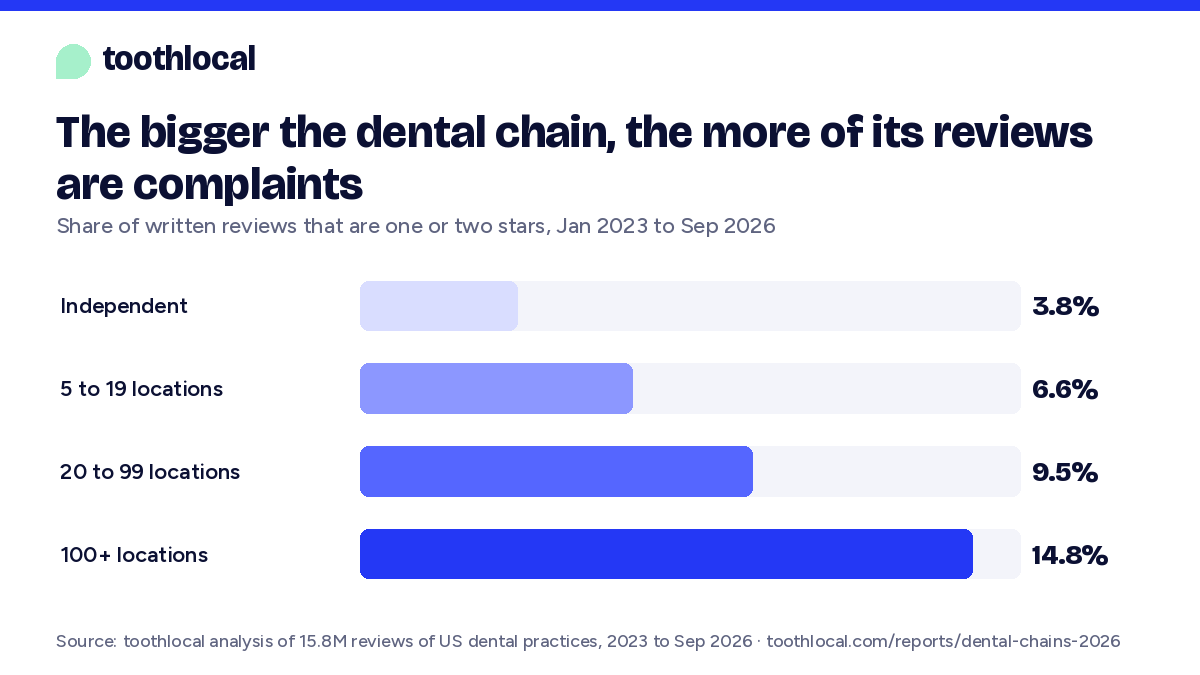
The bigger the dental chain, the more of its reviews are complaints.
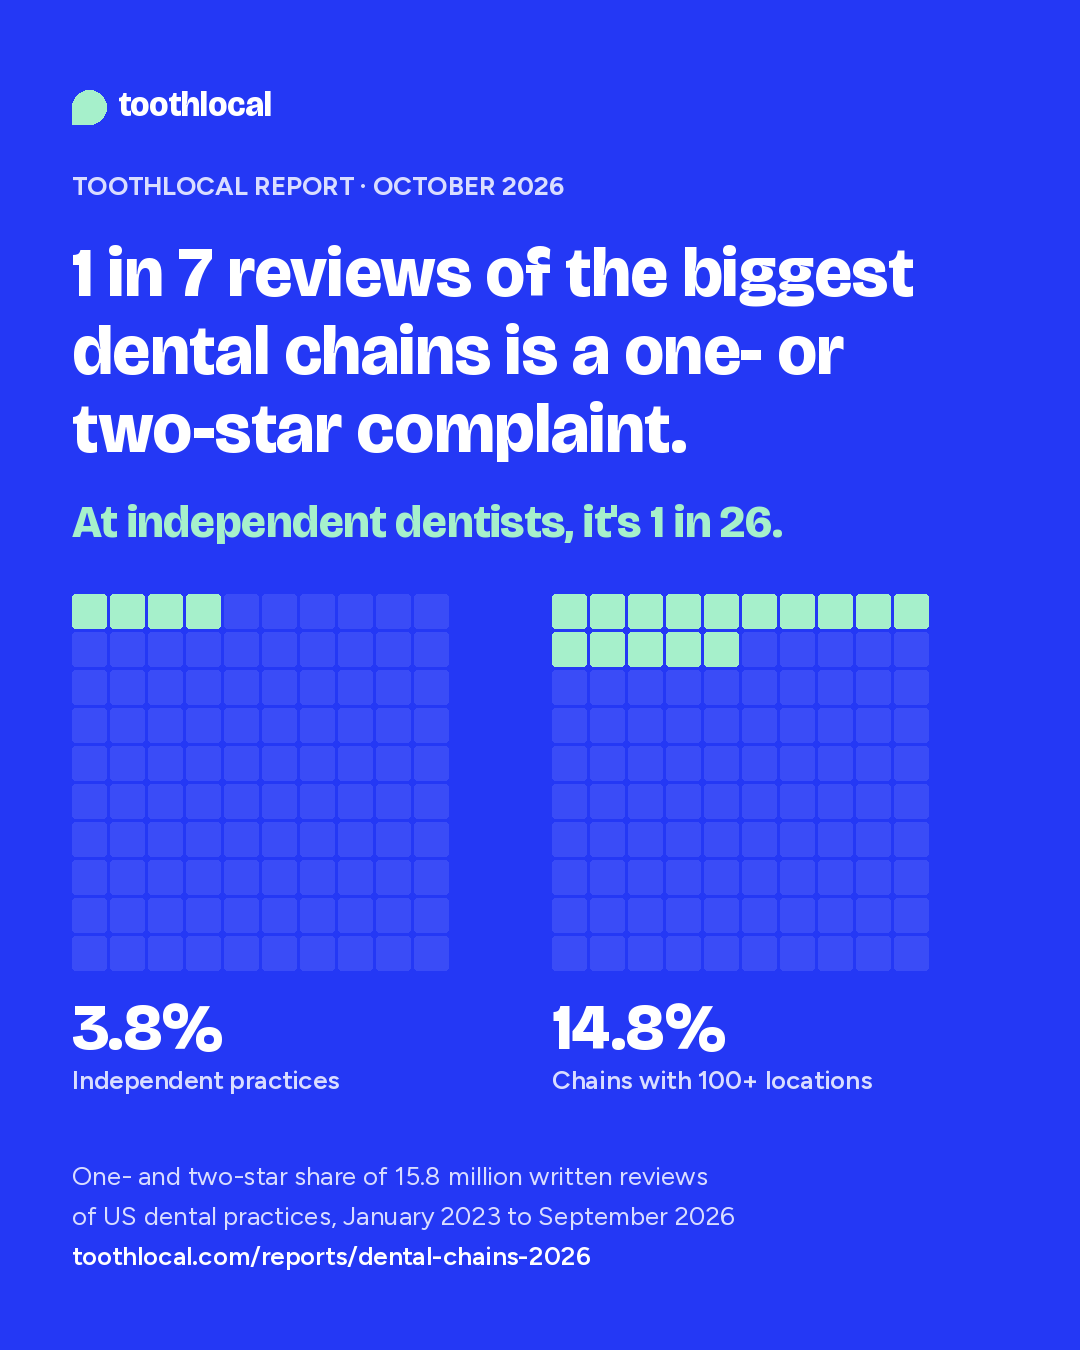
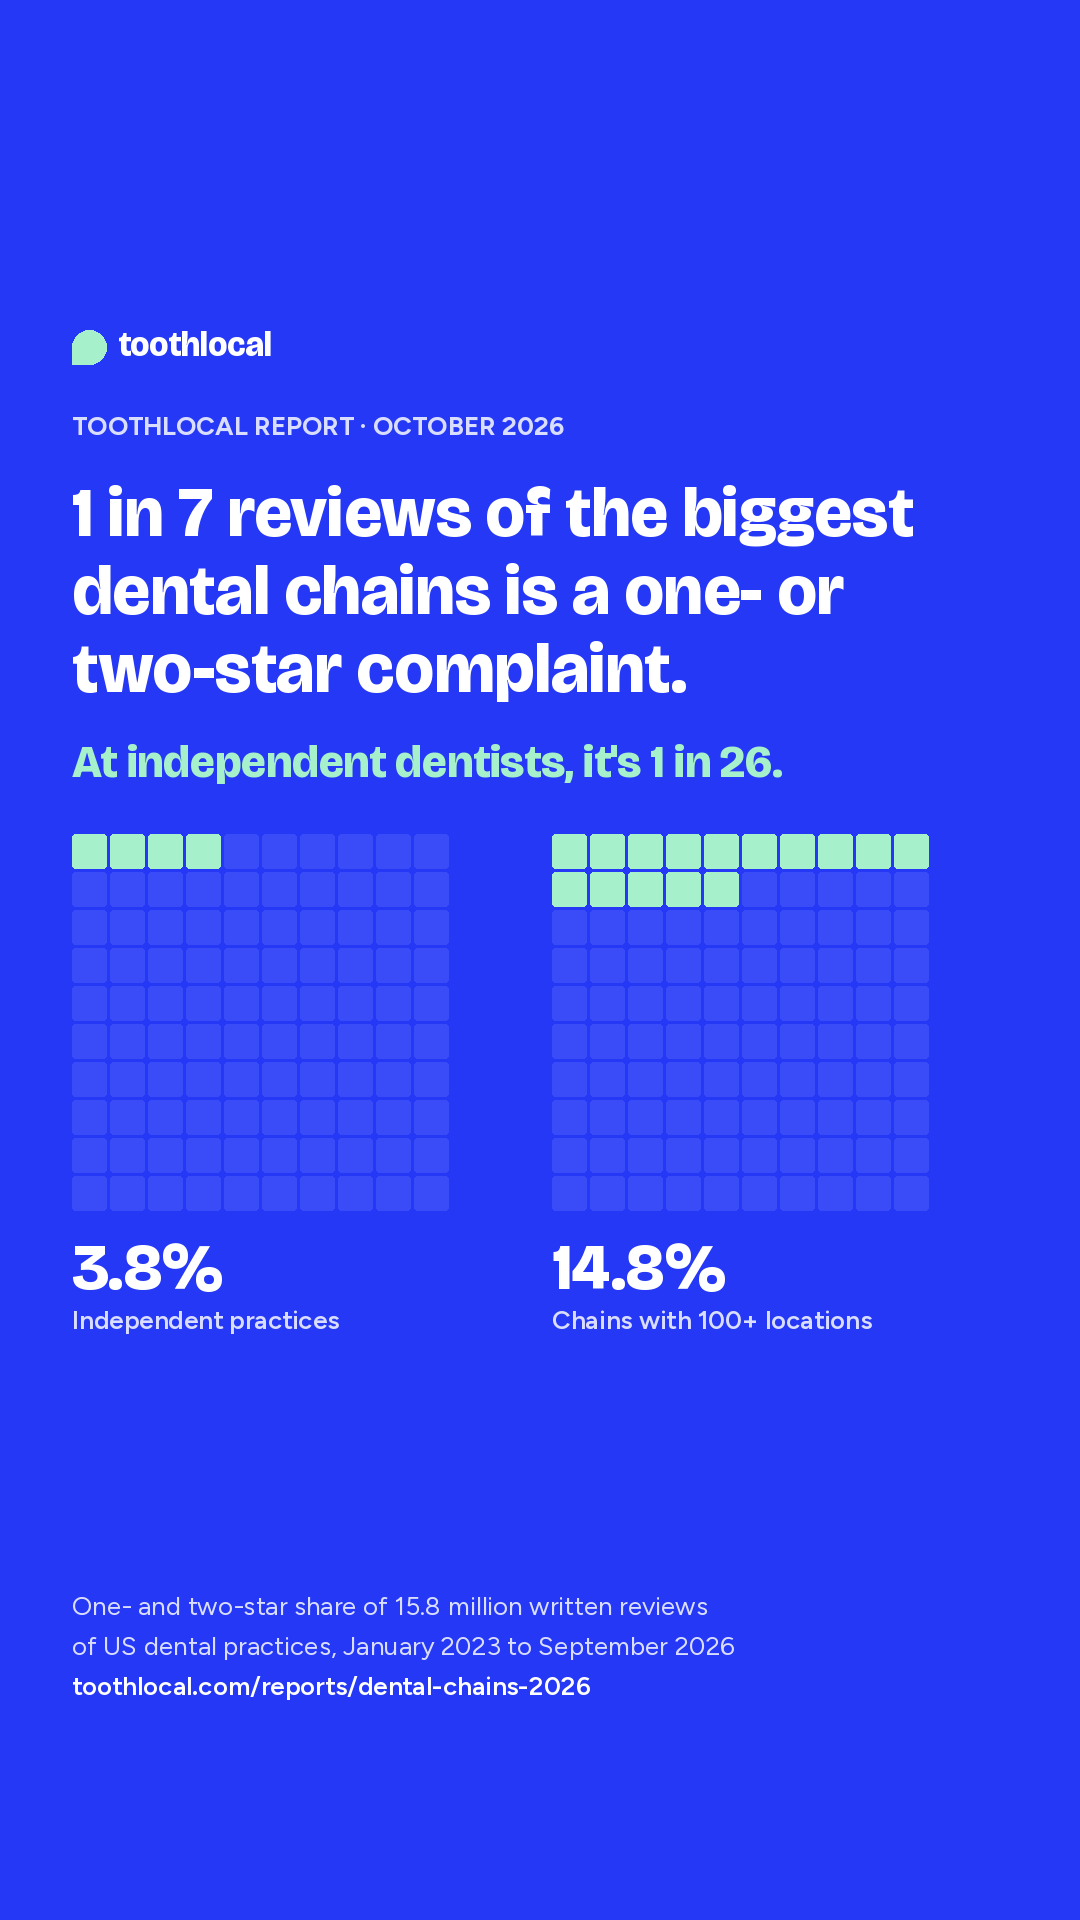
We analyzed 15.8 million written reviews of US dental practices written since January 2023. At independent practices, 1 in 26 is a one- or two-star review. At chains with 100 or more locations, it's 1 in 7. What stands out in the chains' complaints is how the office runs: long waits, double bookings, call centers.
Each step up in size, a bigger share of complaints
For scale: about 1 in 9 of the 145,000 dental practices in the US is identifiable as part of a multi-location group like these.
Groups of 5 to 19 offices sit above independent practices, and the biggest chains are far above them. The typical office shows it too: at the median location of a chain with 100 or more offices, 13.9% of reviews are one or two stars. At the median independent practice it's 2.2%, and about 7 in 10 locations of the biggest chains are above 10%.
Groups of 2 to 4 offices are counted as independent. On their own they sit at 4.1%, between single-office practices (3.4%) and groups of 5 to 19.
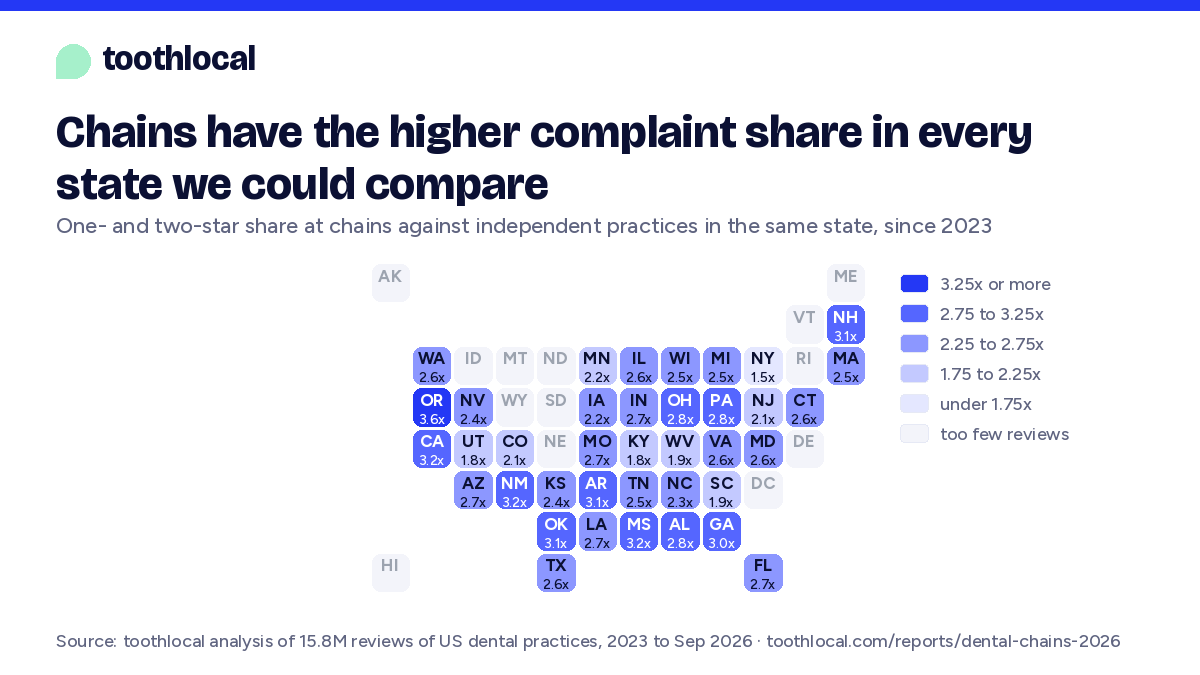
How does your state compare?
Chains have the higher share in all 38 states with enough reviews, from 1.5 times in New York to 3.6 times in Oregon. Tap a state, or pick a state or city below, for its figures, a paragraph you can quote and a chart.
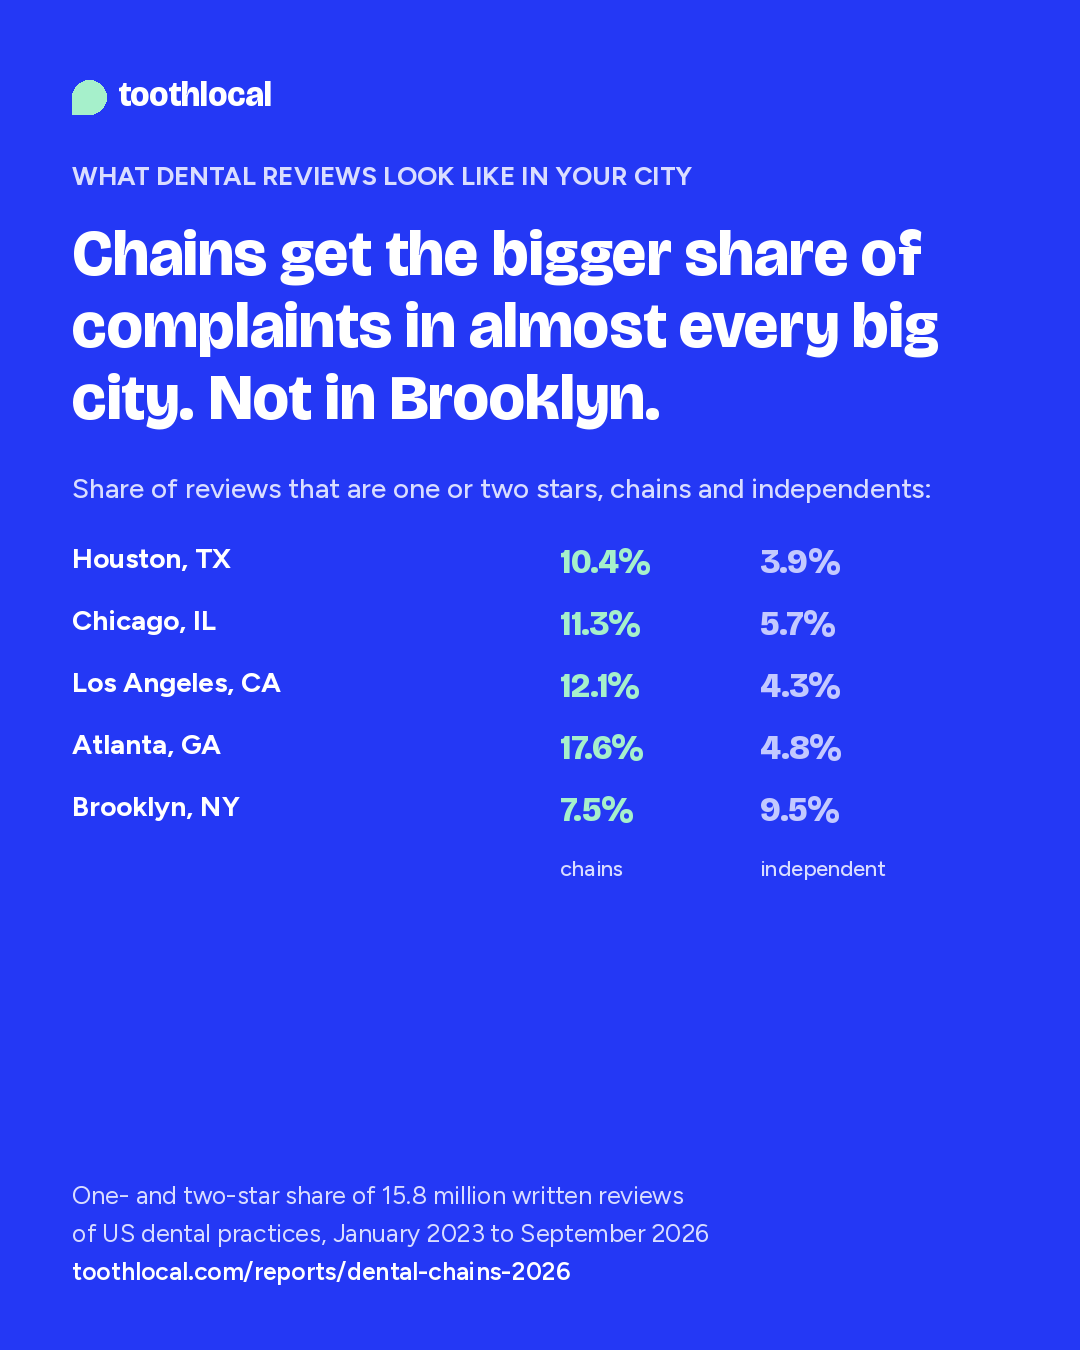
States need 800 one- and two-star reviews on each side, cities 500. Cities are as written on the practices' listings, so suburbs such as Katy, Texas, appear on their own. In two New York City boroughs, Brooklyn and the Bronx, chains come out lower than independent practices.
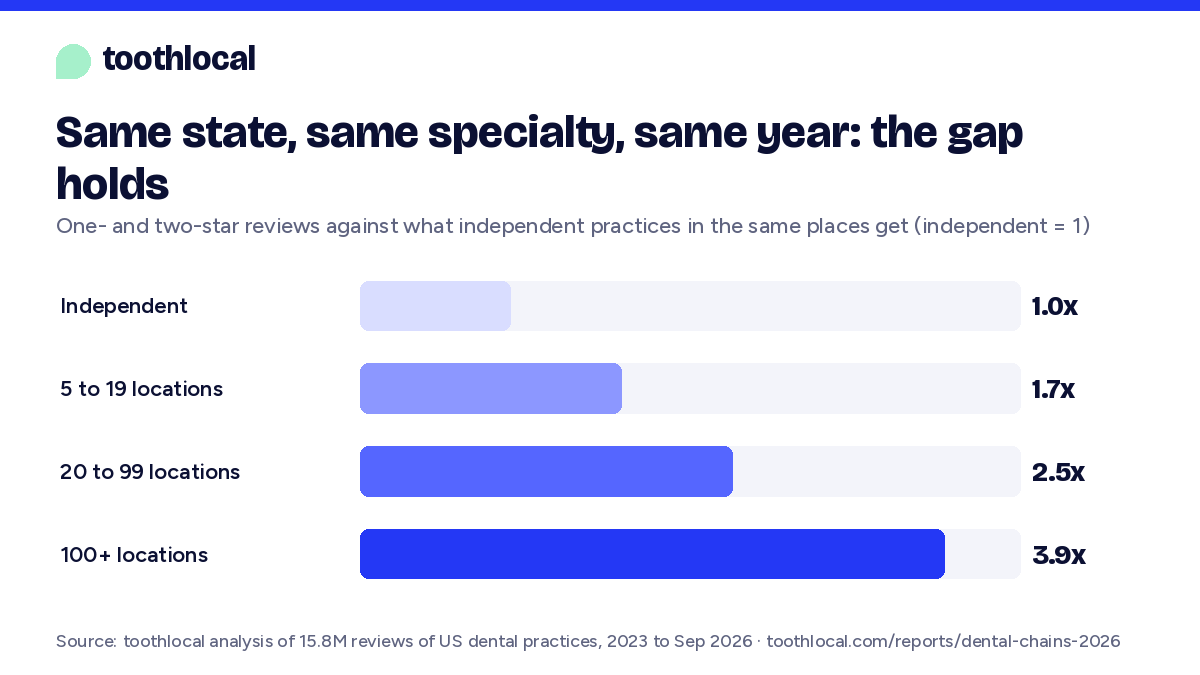
Same state, same specialty, same year: the gap holds
Chains cluster in some states and in general dentistry, so a raw comparison could mislead. We compared each chain review with what independent practices in its state, of its type and in its year get.
1.0 is the independent rate. For chains with 100 or more locations the ratio is 3.9, with a 95% range of 3.3 to 4.4 when whole groups are resampled, so no single group drives it; 962,173 of their 971,035 reviews had independent practices to compare with. The match doesn't adjust for anything about individual offices. Take out the 10 largest chains and the rest still sit at 8.0%, about twice the independent share.
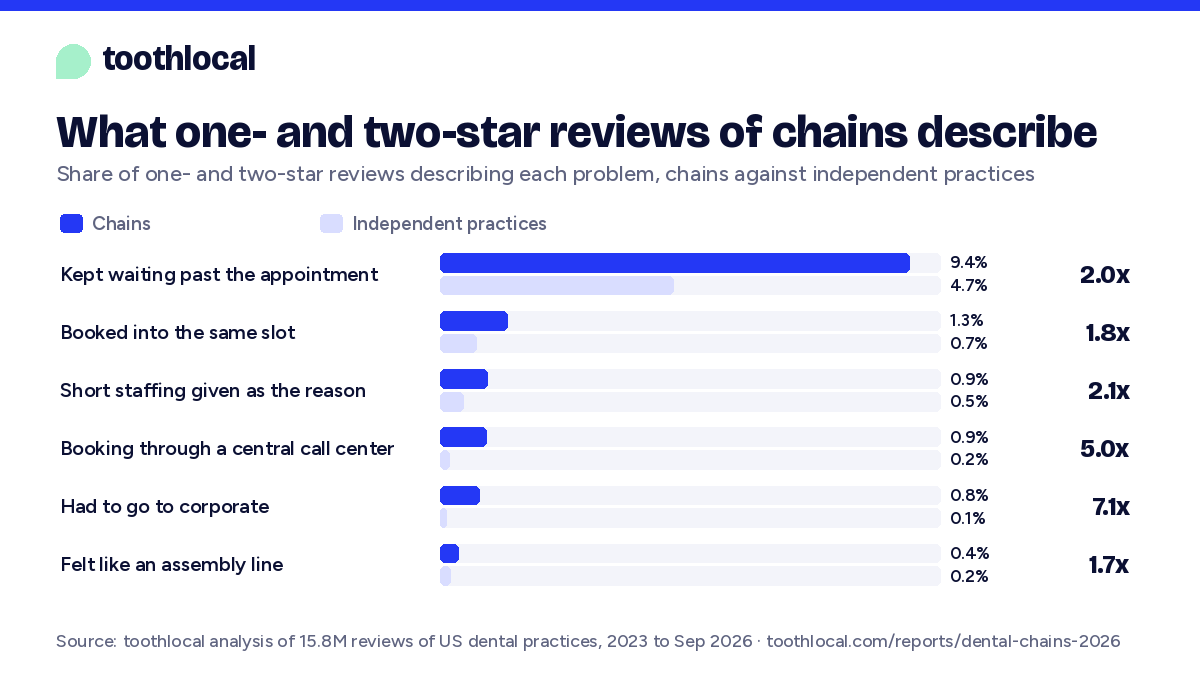
Waiting, booking and getting through
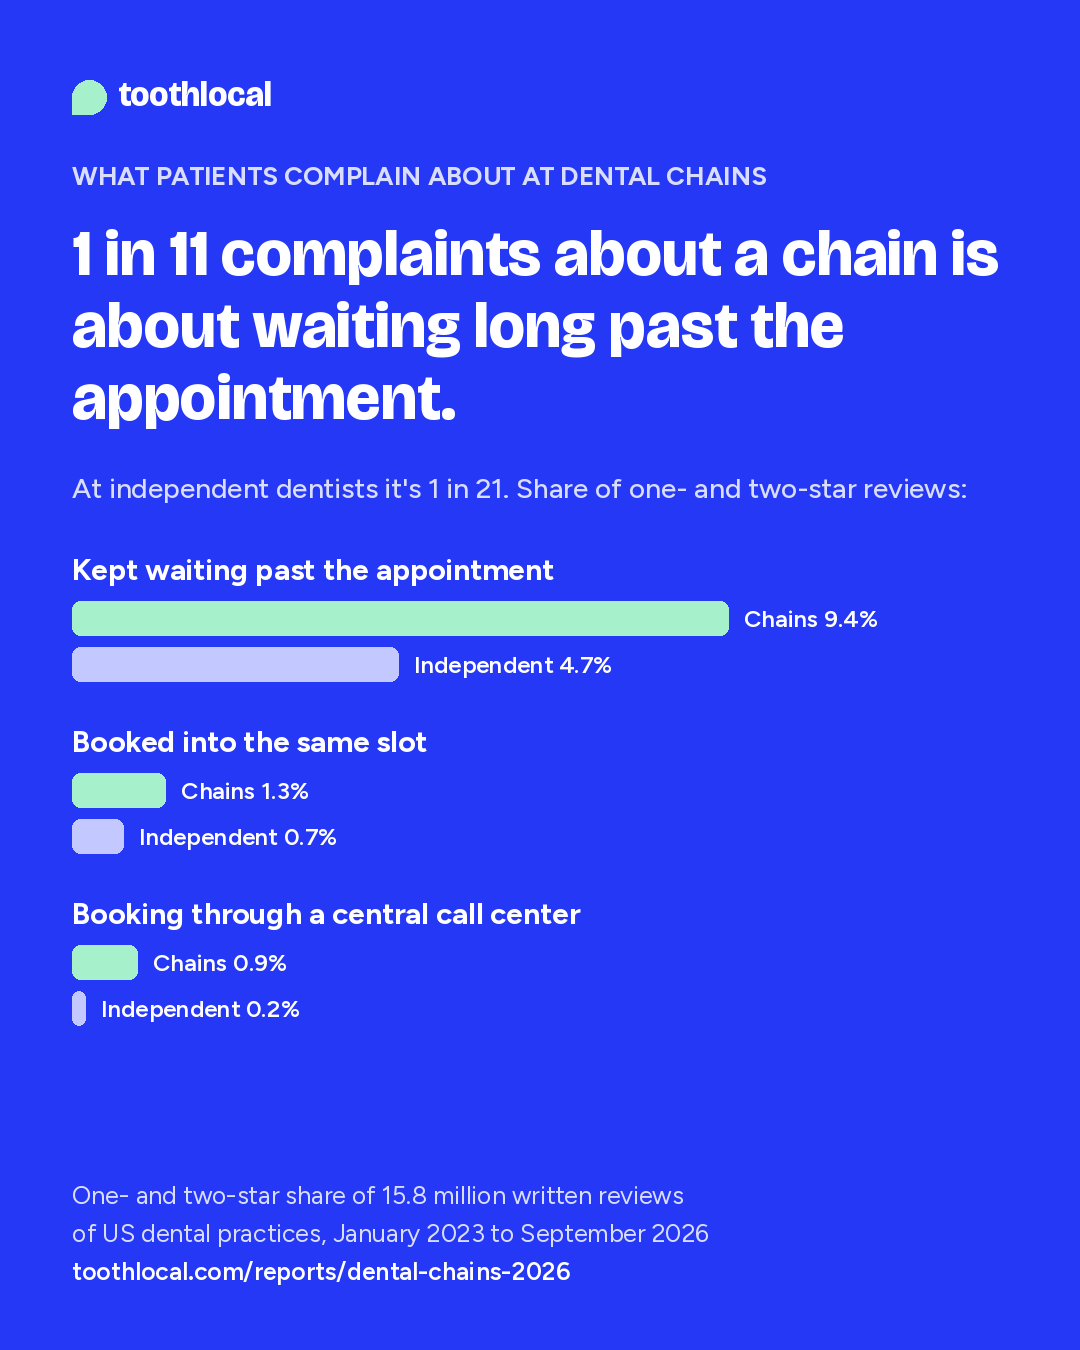
Looking only at one- and two-star reviews, so that a lower rating overall can't drive it, complaints about chains more often describe how the office runs. Waiting tops the list: about 1 in 11 complaints about a chain describes being kept long past the appointment time, against 1 in 21 at independent practices.
ChainsIndependent practicesRight: how many times as common at chains
Going over the office's head to corporate has the biggest ratio, but it's rare (under 1% of chain complaints), most independents have no head office to go to, and the pattern reads correctly only about 7 times in 10. We treat it as color, not a finding.
Complaints at independent practices lean another way. They're about three times as likely to mention the practice changing hands or the old dentist retiring or selling. Some of those patients may be noticing a sale before the office ever appears on a group's website.
Denture complaints are concentrated in the largest chains, which do much more denture work, so we can't say how often each denture patient has a problem. How accurately each pattern reads on each side is under Checks and limits.
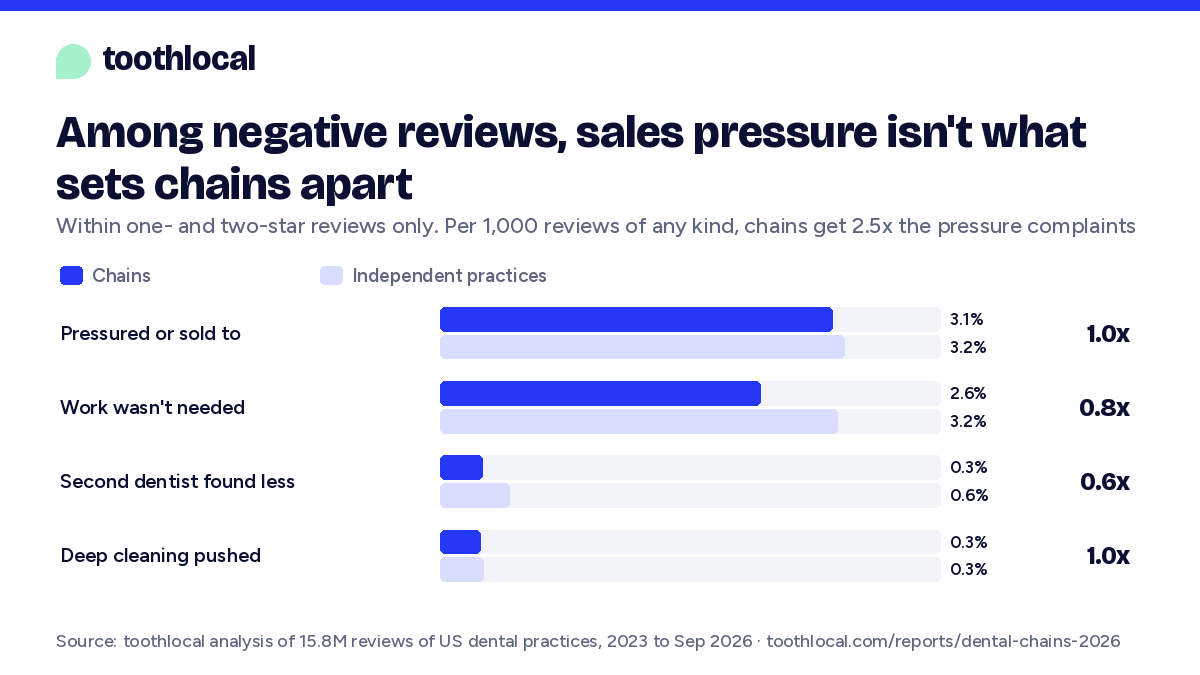
Among one- and two-star reviews, sales pressure isn't what sets chains apart
The charge most often made against corporate dentistry is that it sells people treatment they don't need. Two ways of counting give two answers, and both matter.
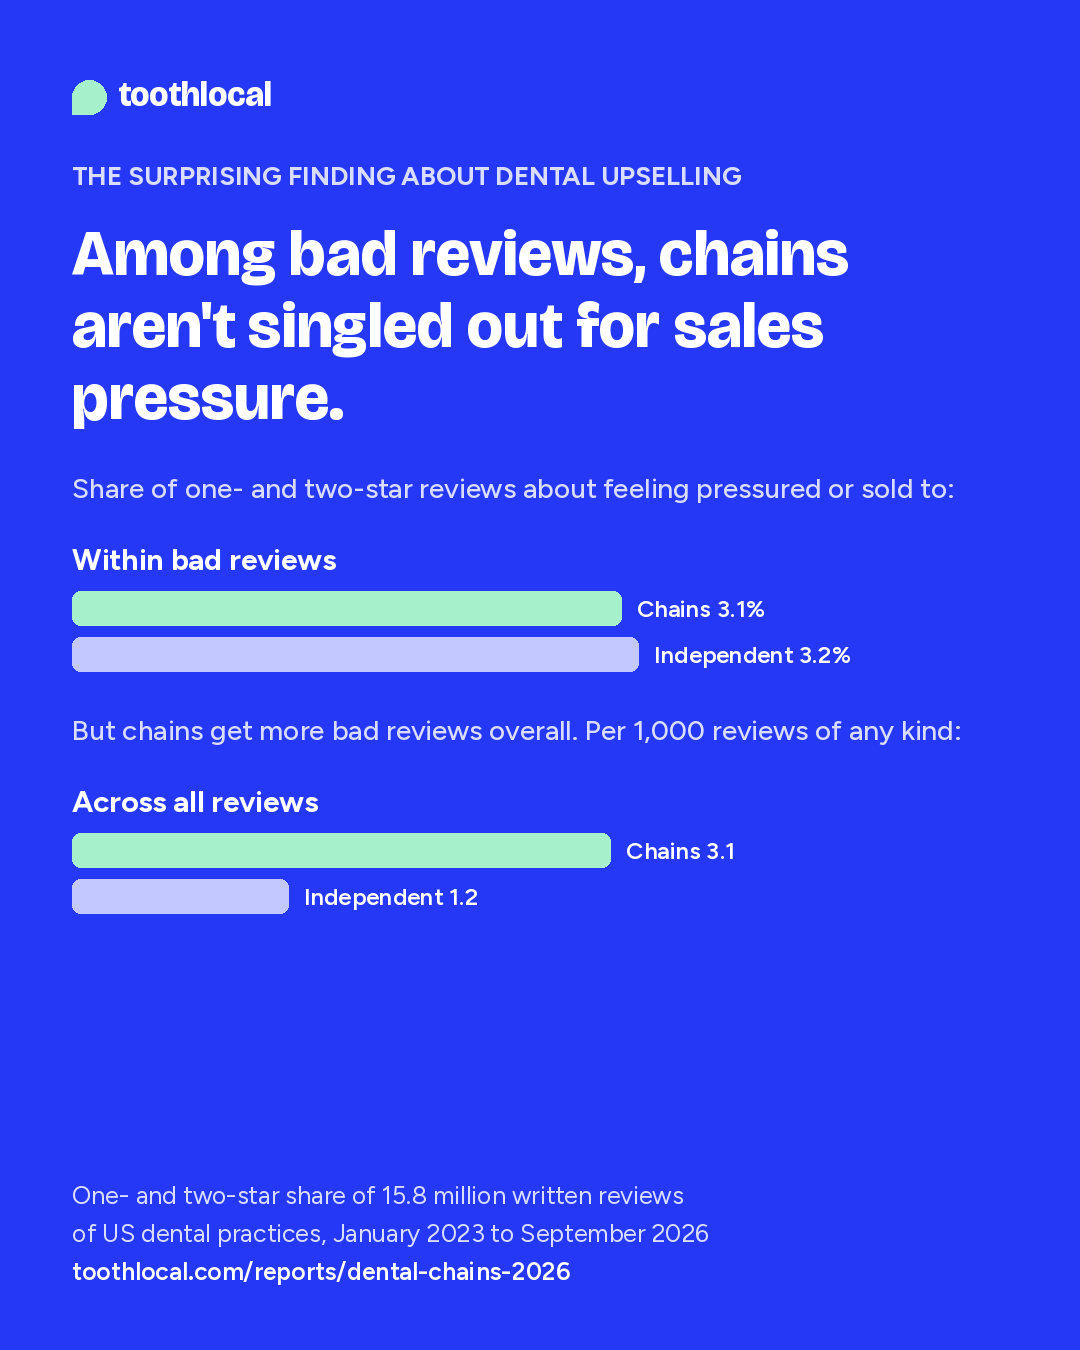
Within one- and two-star reviews, feeling pressured or sold to takes up about the same share at chains (3.1%) as at independent practices (3.2%). Saying the recommended work wasn't needed, or that a second dentist found far less to do, takes up a smaller share at chains.
ChainsIndependent practicesShare of one- and two-star reviews
Across all reviews, chains get more of every complaint, these included, because a bigger share of their reviews are complaints. Per 1,000 reviews of any kind, chains get 3.1 about feeling pressured against 1.2 at independents, about 2.5 times as many.
ChainsIndependent practicesPer 1,000 reviews of any kind
So overselling complaints are part of the chains' larger pile of complaints, but they don't stand out within it the way waiting and booking do.
Each pattern was checked by a blind read of 40 complaints on each side. One narrower complaint, coming in for a cleaning and leaving with a plan worth thousands, looked more common at chains in our read of 2,000 random complaints, but the counts are small (13 and 9) and the matching pattern reads right only about half the time, so we leave it out.
Chains collect more reviews, and answer more of them
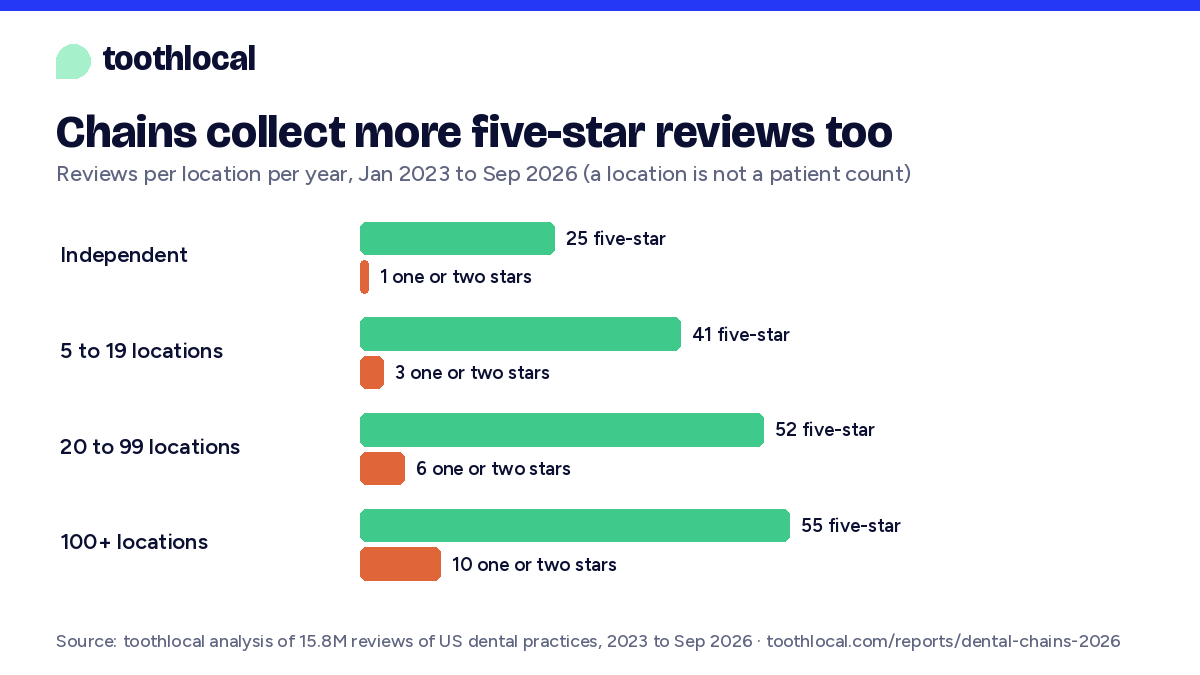
A practice that asks every patient for a review collects lots of five-star ones, which pushes its complaint share down. If chains collected fewer happy reviews than independents, that alone could make their complaint share look worse. It goes the other way: a location of a 100-plus chain gets about 55 five-star reviews a year, against 25 at an independent practice. That's an observed difference, not proof of who asks for reviews more: chain offices get more reviews of every kind.
Five-star reviewsOne- and two-star reviewsPer location, per year
Many chain offices are also bigger. The median location of a 100-plus chain gets about 63 reviews a year, the median independent about 9. A count per location is not a count per patient, which is why this report compares shares, not counts.
Chains reply to more of their complaints too: 65% of their one- and two-star reviews got a reply from the practice, against 43% at independent practices.
Some groups beat the independent average
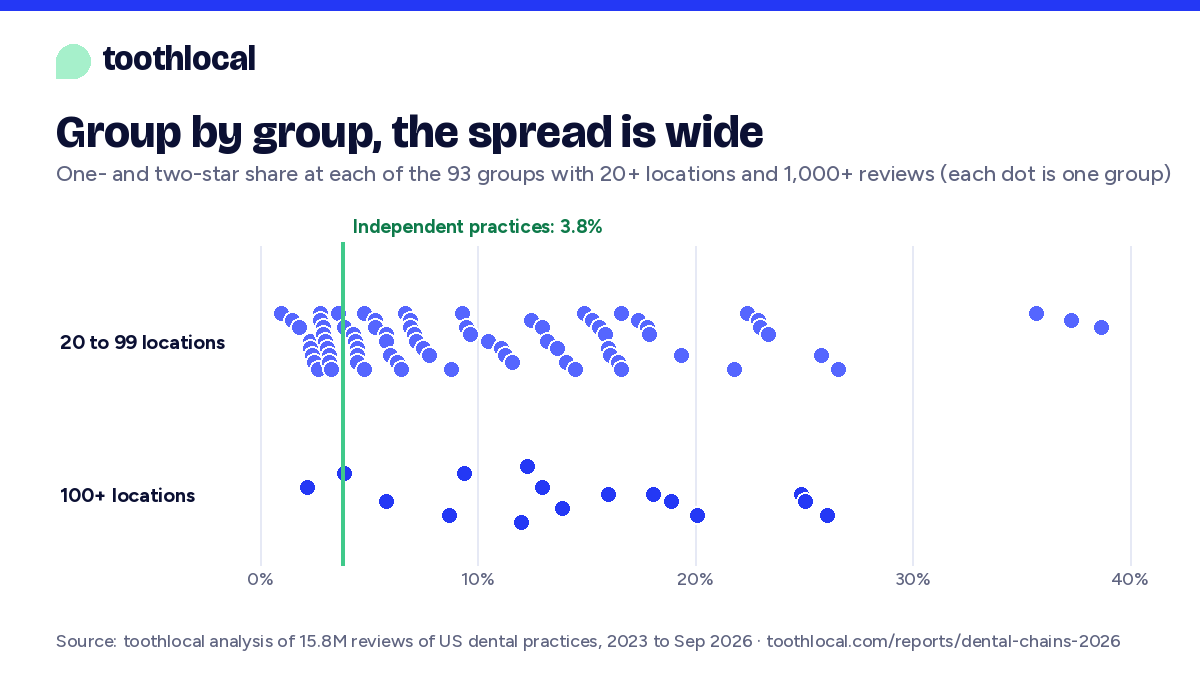
Each dot is one dental group with 20 or more locations and at least 1,000 reviews since 2023, 93 in all. Their one- and two-star share runs from 1% to 39%, and 19 sit below the independent average, so size is only part of the story. We don't name groups, here or in the data files.
Widest in general dentistry
General dental offices are where most chains operate, and where the gap is biggest. Oral surgery is the exception: there, chains come out slightly lower than independent practices.
ChainsIndependent practices
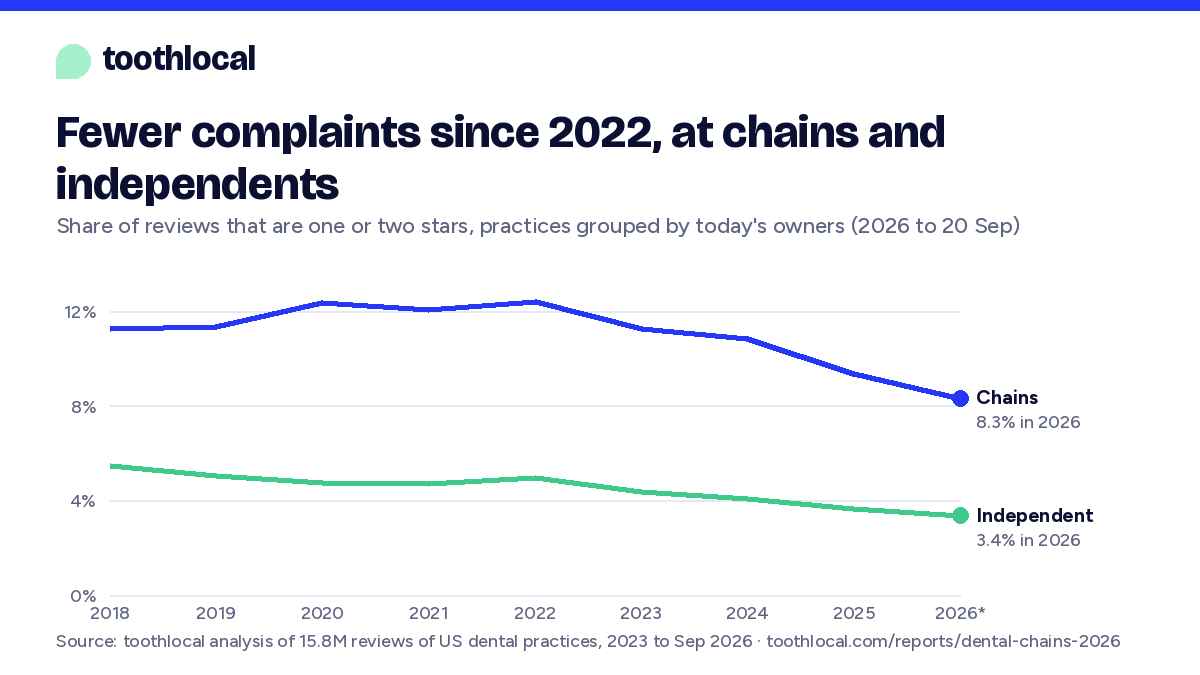
Fewer complaints since 2022, on both sides
From 2020 to 2022 about 12% of chain reviews were one or two stars. By 2026 it was 8.3%. Independent practices fell too, from 5.0% to 3.4%. That could be better care, or more practices asking happy patients for reviews; the data can't tell which. Since 2020, chains have stayed 2.5 to 2.7 times higher every year.
ChainsIndependent practices
Practices are grouped by who runs them today. An office that joined a group in 2021 counts as a chain in 2018 too, so the early years mix in some offices that were independent then, which may be part of why the gap looks narrower in 2018 and 2019. *2026 runs to 20 September.
What we counted
- Chain, or dental group
- Five or more practice listings that share one website. In a check of 76 groups of every size, 74 were plainly one dental organization: one brand name across the offices, or one group running several office names. 2 were unclear and none were unrelated practices. A shared website shows a shared brand; it doesn't prove who owns the offices. Marketing and booking platforms, call networks, community health centers and unrelated sites are not counted as chains.
- Group size
- How many practice listings share the website, so a group of 100 or more has at least 100 listings. 108 groups have 20 or more.
- Independent practice
- Everything else: practices with their own website (3.4% one- and two-star), practices sharing a website with up to three others (4.1%), the few with no website listed (9.2%, 3% of independent reviews), and 1,285 practices whose website is shared by five or more listings but isn't a dental group's (9.5%, under 0.2% of independent reviews). Some offices backed by a dental service organization keep their own name and website, so they count as independent here; the American Dental Association notes that DSO support doesn't always come with a shared brand. We can't say which way that moves the gap.
- Complaint
- A one- or two-star review with written text. These are shares of online reviews, not of patients.
- Like for like
- Chains compared with independent practices in the same state, of the same type (general, orthodontist, oral surgeon and so on) and in the same year.
What we checked, and what we can't say
- Who did the reading. Counting stars needs no judgment; reading what a review says does. That reading was done by an AI model (Anthropic's Claude) working blind: it saw the review text, but not the practice, its owner, its place or the date. It covers the read of 2,000 random complaints, the checks of each complaint pattern below and the check of 76 shared websites. Our team chose the questions, set the rules for each check and went through the results.
- The chain list. The names and states behind the 200 largest shared websites, and a scan of all 1,637 for call networks and marketing sites, moved 10 websites out of "chain". The results barely changed.
- The typical practice. Medians per practice show the same pattern as the totals.
- Without the biggest chains. Removing the 10 largest leaves chains at about twice the independent share.
- Years open. Counting each practice only from its first review, rather than over the full 3.7 years, barely moves the per-location figures (10.8 against 1.1 one- and two-star reviews a year).
- The random read. 2,000 random one- and two-star reviews since October 2023. 1950 were about the practice itself: 1229 at independent practices, 695 at chains, 16 at health systems and 10 at platforms or other sites. Categories were built from the reader's own descriptions, with no list given in advance.
- What the patterns miss. The blind reads measure how often a match is real, not how many relevant complaints a pattern misses. In the random read, the patterns found 57% (chains) and 67% (independents) of the complaints the reader filed under long waits, and 35% and 38% of those about pressure or unneeded work. So every pattern count is a floor. For pressure the miss rate is about the same on both sides; for waits the patterns miss somewhat more at chains, which would make that gap wider, not narrower. These come from small samples (81 and 51 wait complaints).
- Blind reads of each pattern. Complaints matched by each search pattern, read with owner, place and date hidden, to see how often the match is real on each side. Ranges are 95%:
| Pattern | Chains | Independents |
|---|---|---|
| Kept waiting long past the appointment time | 94%77 to 99%, 24 read | 96%80 to 99%, 24 read |
| Patients booked into the same slot | 96%80 to 99%, 24 read | 98%83 to 100%, 24 read |
| Staff shortages given as the reason things went wrong | 92%74 to 98%, 24 read | 83%64 to 93%, 24 read |
| Booking runs through a central or outsourced call center | 88%69 to 96%, 24 read | 100%86 to 100%, 24 read |
| Had to go over the office's head to corporate to get an answer | 69%49 to 84%, 24 read | 69%49 to 84%, 24 read |
| Felt like an assembly line | 98%83 to 100%, 24 read | 98%83 to 100%, 24 read |
| Dentures don't fit and adjustments don't fix it | 90%72 to 97%, 24 read | 98%83 to 100%, 24 read |
| The practice changed hands or got new management | 81%62 to 92%, 24 read | 98%83 to 100%, 24 read |
| The old dentist retired or sold the practice | 92%74 to 98%, 24 read | 96%80 to 99%, 24 read |
| Felt pressured or sold to | 81%67 to 90%, 40 read | 66%51 to 79%, 40 read |
| Believes the recommended work wasn't needed | 79%64 to 89%, 40 read | 89%75 to 95%, 40 read |
| A second dentist found far less work needed | 90%77 to 96%, 40 read | 94%82 to 98%, 40 read |
| Pushed into a deep cleaning instead of a regular one | 90%77 to 96%, 40 read | 89%75 to 95%, 40 read |
What this can't tell you
- Why. We haven't tested causes such as staffing, private equity ownership, patient mix (insurance, income, Medicaid), practice age, or city against country. This report describes what reviewers write, not why.
- How patients feel overall. Reviews come from the patients who choose to write one. The shares describe online reviews, not how many patients are unhappy, and not the quality of the dental care.
- Any one office. Many chain locations get good reviews, and some groups beat the independent average.
How we measured it
- The reviews
- Written reviews on the public business listings of US dental practices, collected by toothlocal up to 20 September 2026: every written review shown on each listing at the time. The collection found 234,655 dental listings in all 50 states and DC; 164,946 have at least one written review, 24.7 million in all. This report uses the 15.8 million dated 1 January 2023 or later. Practices with no business listing, and reviews removed before collection, aren't included. It's the same data behind every toothlocal page.
- What you can check
- Every figure on this page is in the data files, with blind-read accuracy and ranges. The review texts and our database aren't published, so the counts can't be rerun from outside without collecting the reviews again.
- Chains
- Practices grouped by the website they list. A website shared by five or more practices is a chain, after removing marketing platforms, booking and call networks, community health centers and unrelated sites. Group size is the number of practices sharing the website.
- Like for like
- For each state, practice type and year, we took the independent practices' one- and two-star share and asked how many such reviews chains would have had at that rate, then divided the real count by it.
- Complaint patterns
- Search patterns from our review reading, counted within one- and two-star reviews, each checked with a blind read on both sides.
- About toothlocal
- toothlocal is a free dentist finder. We don't sell placement: no practice, chain or independent, can pay to change where it appears or what we show. About us, How we know. Something wrong? Tell us.
Use the charts and data
Everything on this page is free to use with a credit and a link. Pick a state or city above for a ready-made paragraph and a chart. Each chart has its own embed code.
The key figures, ready to quote
About 1 in 7 reviews of US dental chains with 100 or more locations is one or two stars (14.8%), against 1 in 26 at independent practices (3.8%), January 2023 to September 2026.
The share rises with group size: 6.6% at groups of 5 to 19 locations, 9.5% at 20 to 99 and 14.8% at 100 or more.
Measured against independent practices in the same state, of the same type and in the same year, chains with 100 or more locations get 3.9 times the one- and two-star reviews (95% range 3.3 to 4.4).
About 1 in 11 one- and two-star reviews of chains describes waiting long past the appointment time (9.4%), twice the share at independent practices (4.7%).
Among one- and two-star reviews, feeling pressured or sold to takes up about the same share at chains (3.1%) as at independent practices (3.2%). Per 1,000 reviews of any kind, chains get about 2.5 times as many (3.1 against 1.2), because more of their reviews are complaints.
Chains replied to 65% of their one- and two-star reviews; independent practices replied to 43%.
Chains have the higher one- and two-star share in all 38 states with enough reviews to compare, from 1.5 times in New York to 3.6 times in Oregon.
19 of the 93 dental groups with 20 or more locations and 1,000+ reviews have a lower one- and two-star share than independent practices overall. Across those groups the share runs from 1% to 39%.
Cite
Charts
Social cards
Data files
- By group size shares, per-practice medians, like-for-like ratios, reviews per location, replies
- By state 38 states with 800+ one- and two-star reviews on each side
- By city 57 cities with 500+ on each side
- By year 2018 to 2026, grouped by today's owners
- By practice type since January 2023
- What complaints describe with blind-read accuracy and 95% ranges on each side
- Group by group 93 groups, anonymized (size band, review-count band, share)
- Inside the independent figure own website, small groups, no website
Other reports
- How many dental practices are in the US? 2026 October 2026
- AI Review Index 2026 October 2026
Find a dentist on what patients actually say
toothlocal reads every review, each practice's own website and the public license records, so you can choose on facts, not ads.
Find a dentist near you