America has about 145,000 dental practices. How many are open when patients need them?
There are about 145,000 active dental practices in the US, one for every 2,355 people. Having one nearby isn't the same as finding one that fits your week. Of practices that publish their weekly hours, about 4 in 5 list no Saturday hours, and about 1 in 4 is closed on Fridays when checked against its own website. We counted practice listings in every state, then linked them to the NPI registry, state dental boards, the federal children's Medicaid directory, industry payment records and 84,000 practice websites.
How many dental practices are in the US?
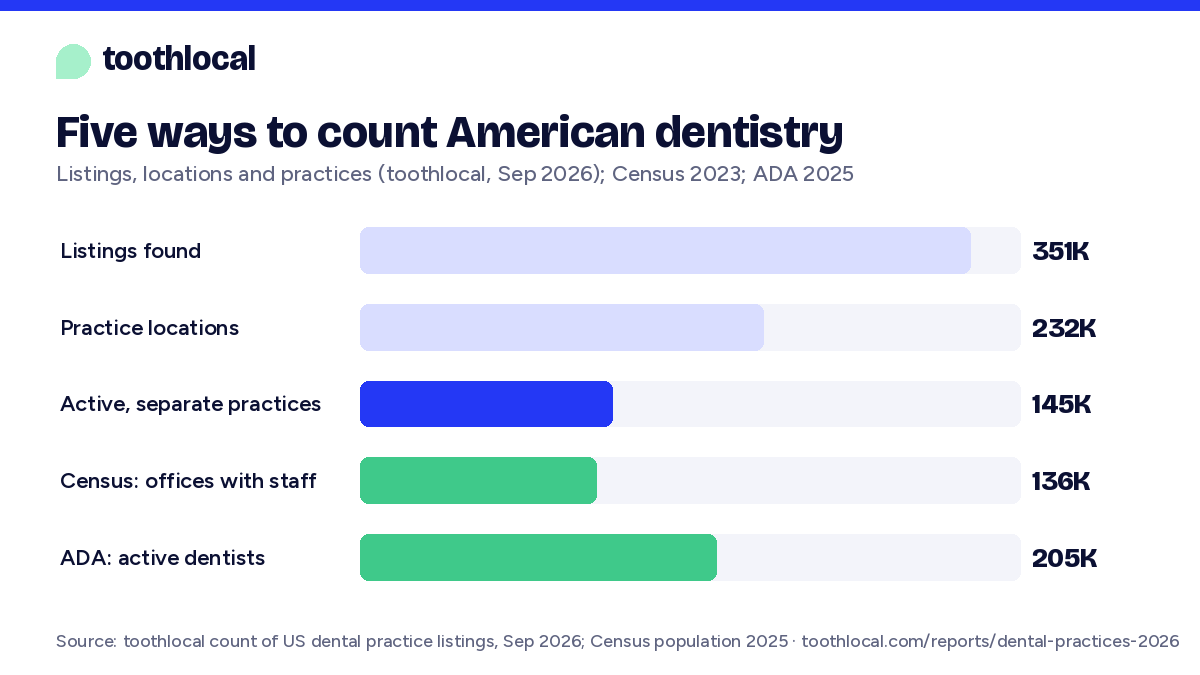
About 145,000 active dental practices, or dental offices, by our count. There isn't one official number for dental practices, because different sources count different things:
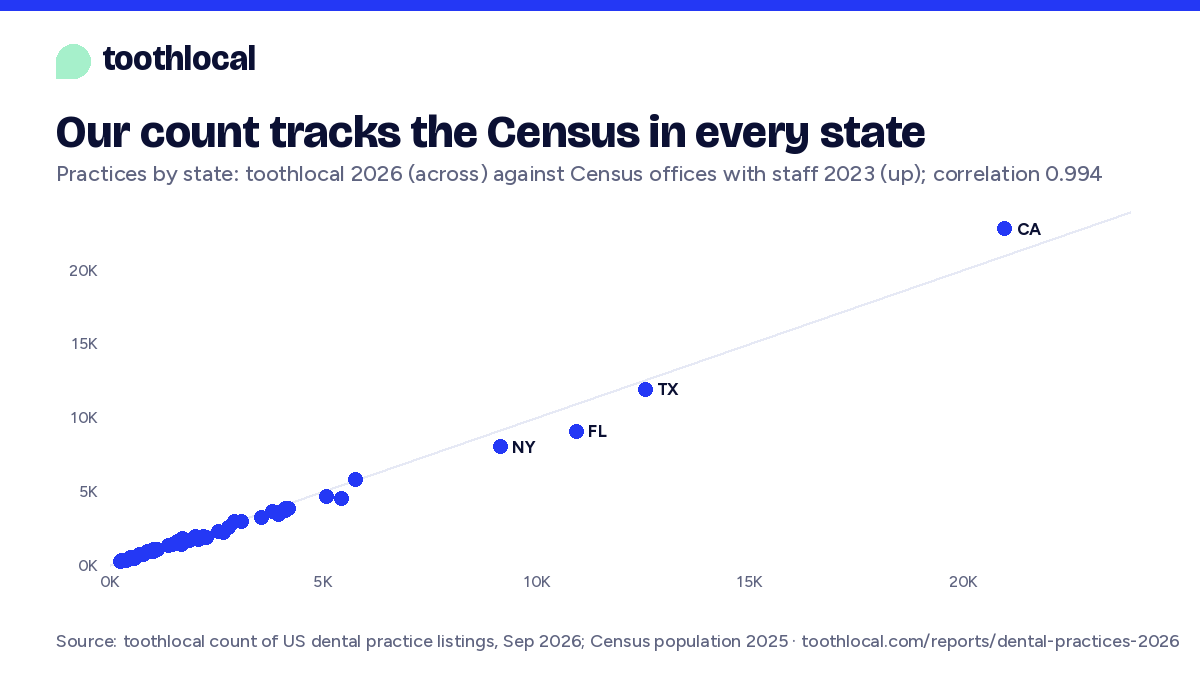
Many dentists have a listing of their own as well as their office's, so listings overcount. We merged duplicates, checked a sample of 770 locations blind, and left out 61,372 practice locations with no sign of activity in two years, plus 1,484 listings with no US address. The result sits 7% above the Census Bureau's 2023 count of dental offices with staff, and tracks it state by state (correlation 0.994). Details are under Checks.
How many dentists are in the US?
The American Dental Association counts 205,088 professionally active dentists (2025), 60.0 per 100,000 people, or about 1.4 per practice. The federal NPI registry lists 275,954 individual dentists, more than the ADA because it still holds retired and non-practicing dentists. 162,960 of them are linked to an active practice in our count.
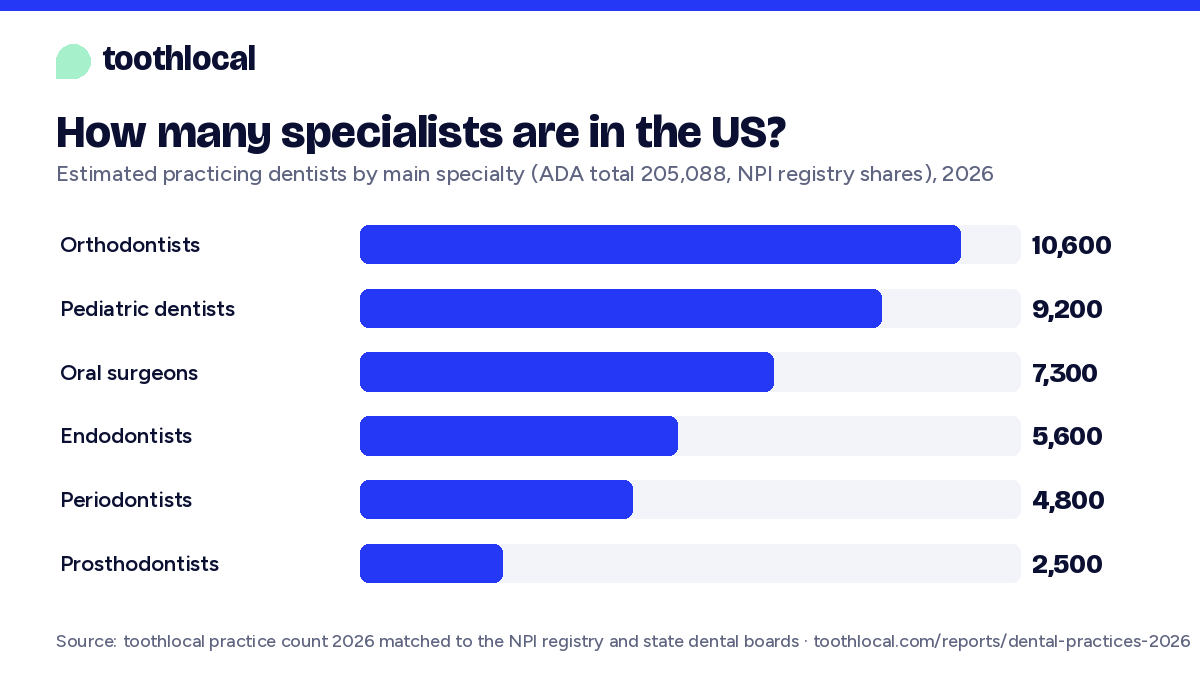
About 21% of those linked dentists have a specialty as their main one, close to the ADA's 21.2%. Applying each specialty's share to the ADA total gives a working count of practicing specialists. It is an estimate; the registry and linked columns bracket it.
| Main specialty | Estimated practicing | Linked to an active practice | In the NPI registry |
|---|---|---|---|
| General dentists | 162,900 | 129,443 | 221,282 |
| Orthodontists | 10,600 | 8,417 | 13,722 |
| Pediatric dentists | 9,200 | 7,314 | 11,041 |
| Oral surgeons | 7,300 | 5,785 | 8,555 |
| Endodontists | 5,600 | 4,471 | 6,755 |
| Periodontists | 4,800 | 3,795 | 6,689 |
| Prosthodontists | 2,500 | 2,024 | 3,949 |
| Other dental specialties | 2,200 | 1,711 | 3,961 |
Main specialty is the registry's primary taxonomy for each dentist. Estimated practicing = share of linked dentists in that specialty × the ADA's 205,088. A dentist who works at several offices counts once here; the practice counts elsewhere on this page are locations, not people. Women, age and practice size are under Who works there.
About 4 in 5 practices have no Saturday hours, and 1 in 4 closes on Fridays
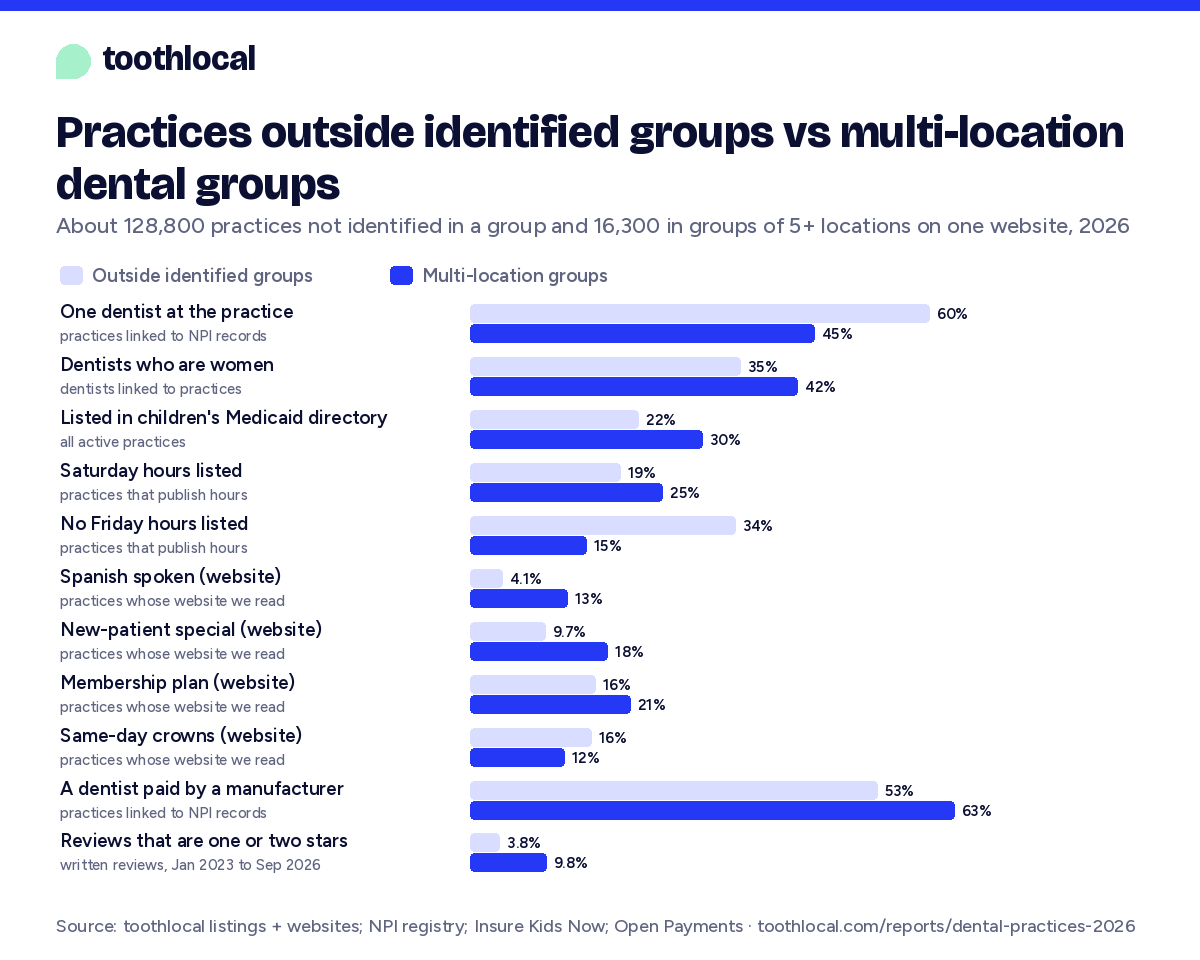
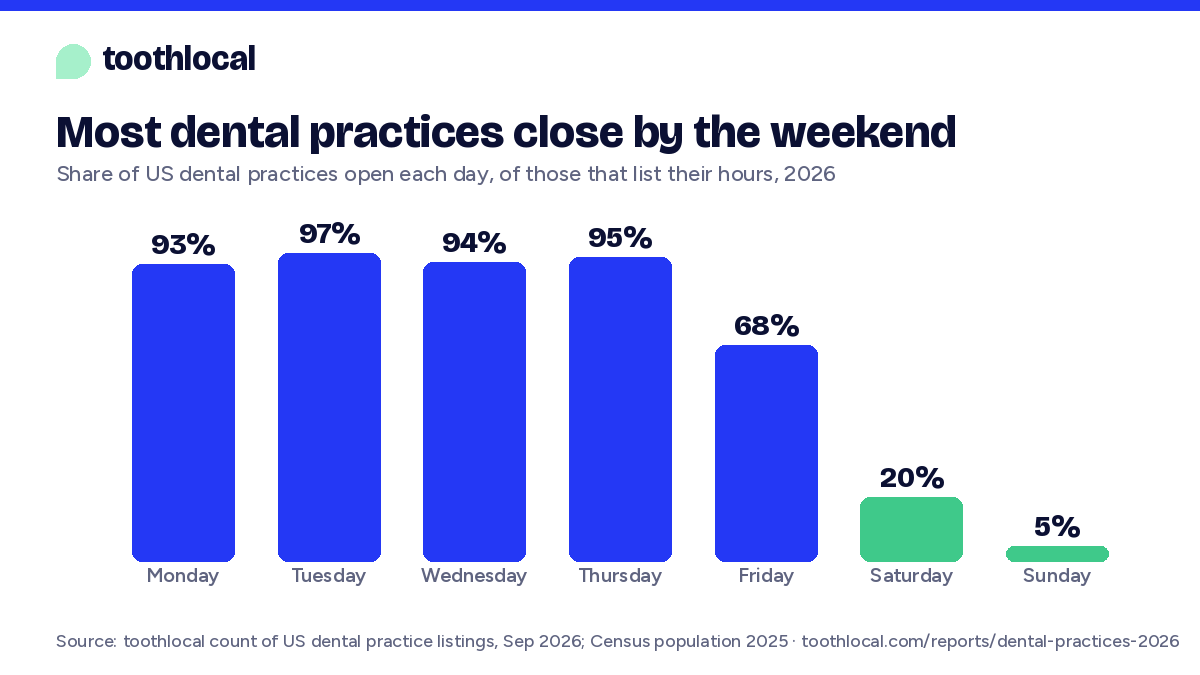
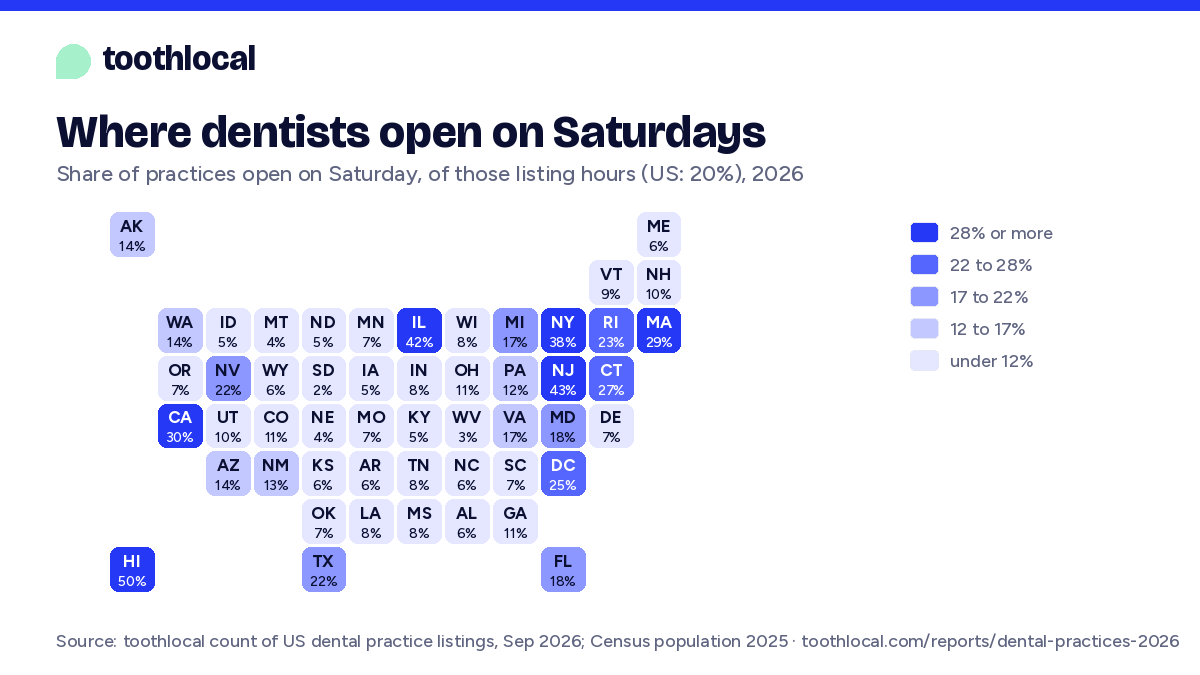
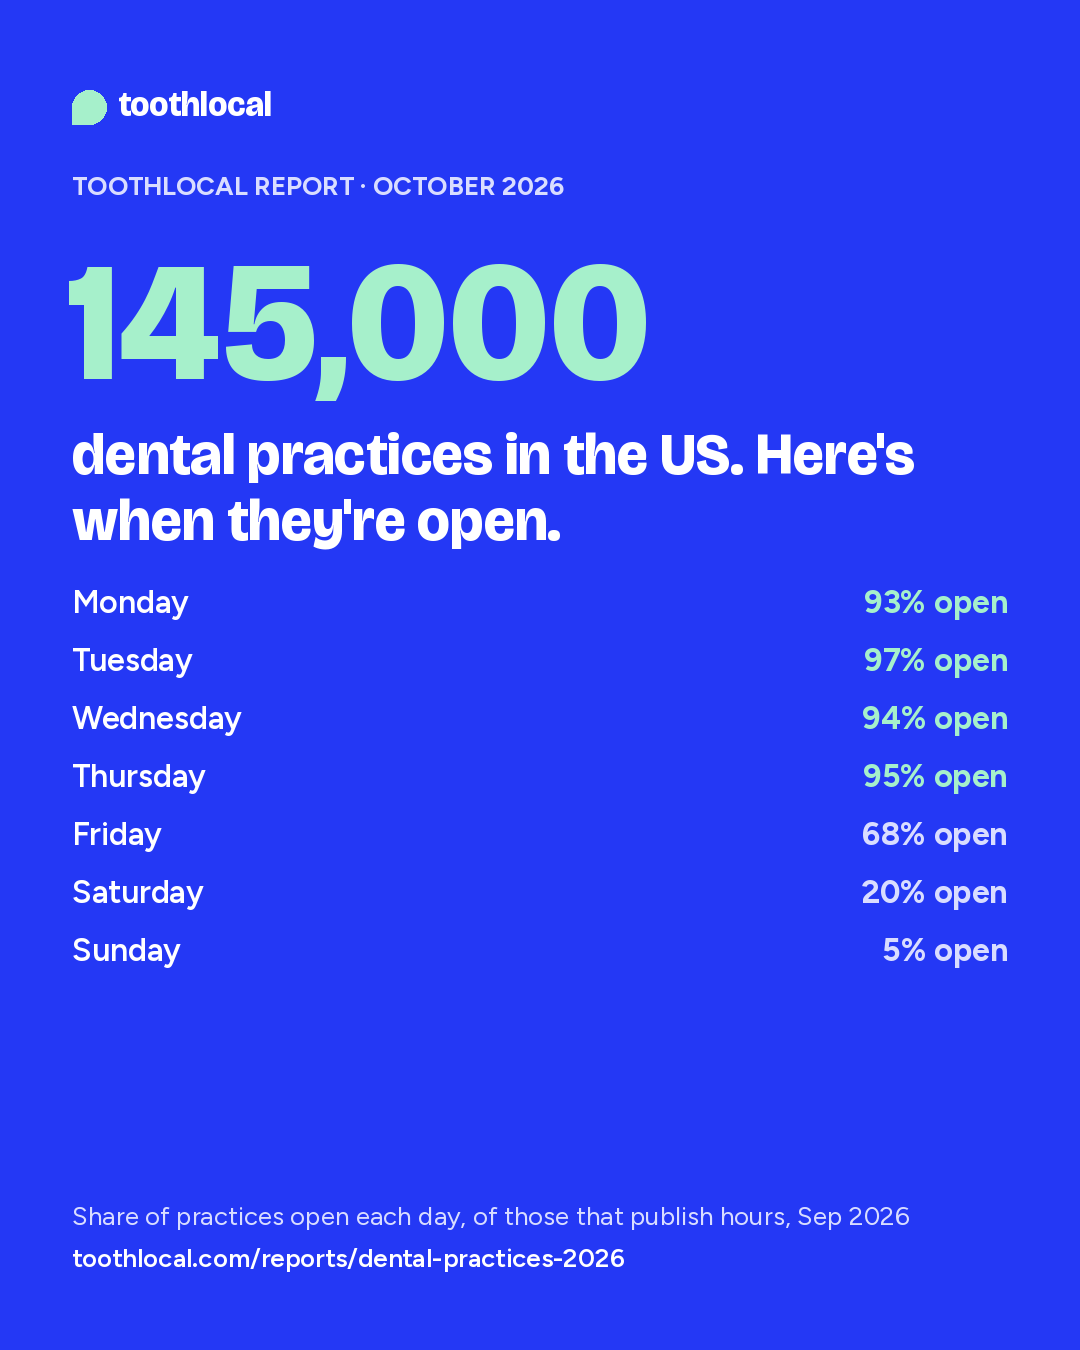
Are dentists open on weekends? Mostly not. Of practices that publish their weekly hours, only 20% list Saturday hours and 5% list Sunday hours. Fridays are the surprise: 32% list no Friday hours at all. Listings aren't always right, so we checked a sample against the practices' own websites. Saturday held up (about 19% open). Friday came down: some practices marked closed see patients by appointment or one Friday a month, and about 25% are closed on Fridays by their own websites. Either way, the typical practice is open 39 hours a week, and for anyone who can't easily take time off work, that narrows the choice. Practices in dental groups list Saturday hours more often (25% against 19%) and list no Friday hours far less often (15% against 34%).
The chart shows weekly hours as published on 139,208 active practices' listings, September 2026. The check: 180 practices whose own website states its hours, chosen by what the listing says (closed Friday, open Friday, open Saturday, open Sunday; at most five per state), read blind against the website alone. Where the listing said closed Friday, the website agreed 72% of the time; open Friday, 97%; open Saturday, 79%; open Sunday, 65%. Website-based shares: closed Friday 21 to 29%, open Saturday 15 to 24%. Published hours, on listings or websites, can differ from when appointments are available.
About 1 in 9 practices is identifiable as part of a multi-location dental group
About 16,300 practices (11%) were identifiable as part of a multi-location dental group, often called a dental support organization (DSO) or a dental chain: five or more offices on one group's website. The other 89%, about 128,800, were not identified as part of such a group. Many of those are likely independent, but the group includes practices whose owner we can't see, and offices of a group that gives each one its own website.
That measures shared branding, not ownership. Some groups are owned by dentists, some are backed by investors, and listings can't tell which. The American Dental Association measures it a different way, by dentist: 16% of dentists were affiliated with a dental support organization in 2024.
How they differ
Group practices more often list Saturday hours and far less often list no Friday hours. They are more often listed in the children's Medicaid directory, more often say their staff speak Spanish, and more of their dentists are women. Their reviews are more than twice as likely to be one or two stars; what those patients complain about is in our dental chains report. These are differences between the two kinds of practice, not proof that belonging to a group causes them.
Outside identified groupsMulti-location groups
Each row has its own base. Dentist and manufacturer-payment rows cover practices linked to the NPI registry; hours cover practices that publish them; website rows cover practices whose website we read; Medicaid covers all active practices; reviews are written reviews from January 2023 to September 2026, as in the chains report.
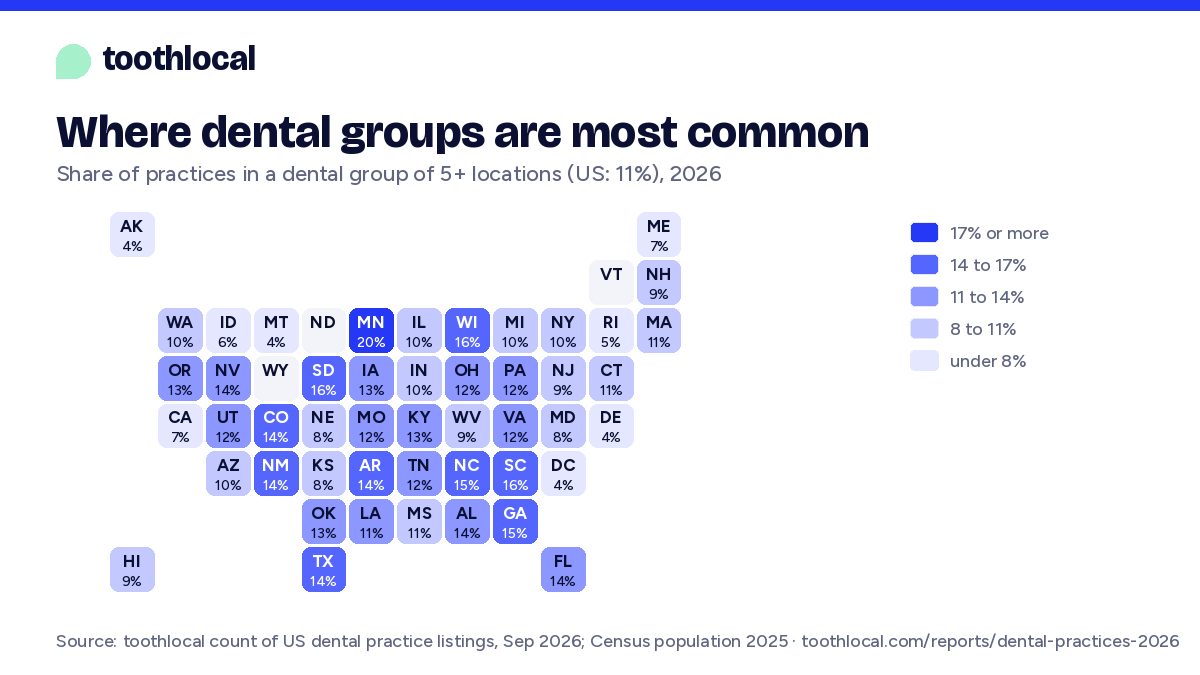
Which specialties and states
Groups are most common in oral surgery (23% of practices) and orthodontics (18%), and least in gum care. By state they range from 20% of practices in Minnesota to 4% in Delaware.
A dental group here is a website shared by five or more practice locations, after booking platforms, community health centers and unrelated sites are set aside: the same rule as our chains report, where a blind check of 76 groups found 74 plainly one organization. Groups that let each office keep its own website aren't identified, so the group share is a floor. The chains report counts about 15,300 group locations with written reviews since 2023; this page counts active practices weighted by the duplicate checks, so the totals differ. No group is named.
Fewer than 1 in 4 practices are listed in the children's Medicaid directory
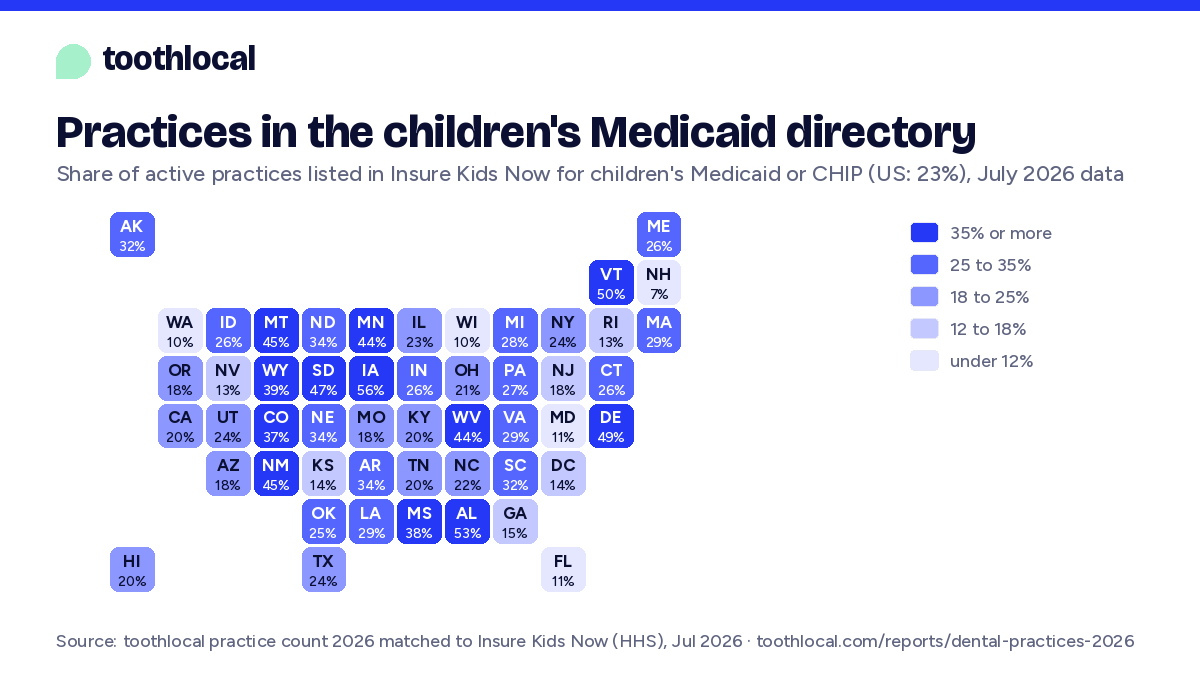
23% of active practices are listed in Insure Kids Now, the federal directory of dentists in children's Medicaid and CHIP plans. A listing isn't an open appointment: the directory marks separately whether a dentist takes new patients, so families should call first. The share listed varies sharply by state: tap a state on the map. Pediatric practices are listed far more often (49%), and so are practices in dental groups (30%, against 22% of other practices).
Children's plans only: Insure Kids Now lists dentists in Medicaid and CHIP plans for children (state data updated July 2026), matched to practices by phone or by the dentist's NPI. Shares are of estimated practices, each location weighted by the duplicate checks. Adult Medicaid dental coverage varies by state and isn't measured here.
What this means when you're looking for one
- Check hours on the practice's own website, then call. In our check, listings were wrong about Fridays often enough to matter, and a practice that lists Friday hours may only take appointments some Fridays.
- If you need a Saturday or an evening, ask for it by name. Only about 1 in 5 practices opens on Saturdays and about 1 in 6 stays open past 6:30 pm on a weekday. Practices in dental groups list Saturday hours more often.
- For a child on Medicaid or CHIP, start with the Insure Kids Now dentist locator: choose your state and your child's plan, and use its new-patient filter. Then call to confirm.
- To compare practices near you, search toothlocal for hours, reviews and what each practice offers.
Most practices we could link to dentist records have one dentist
Of the 100,103 practices we could link to the dentists who work there through the federal NPI registry, 58% have one identified dentist and 24% have two. Only 3% have six or more. Even practices in dental groups are often one-dentist offices (45%, against 60% elsewhere).
Women in dentistry
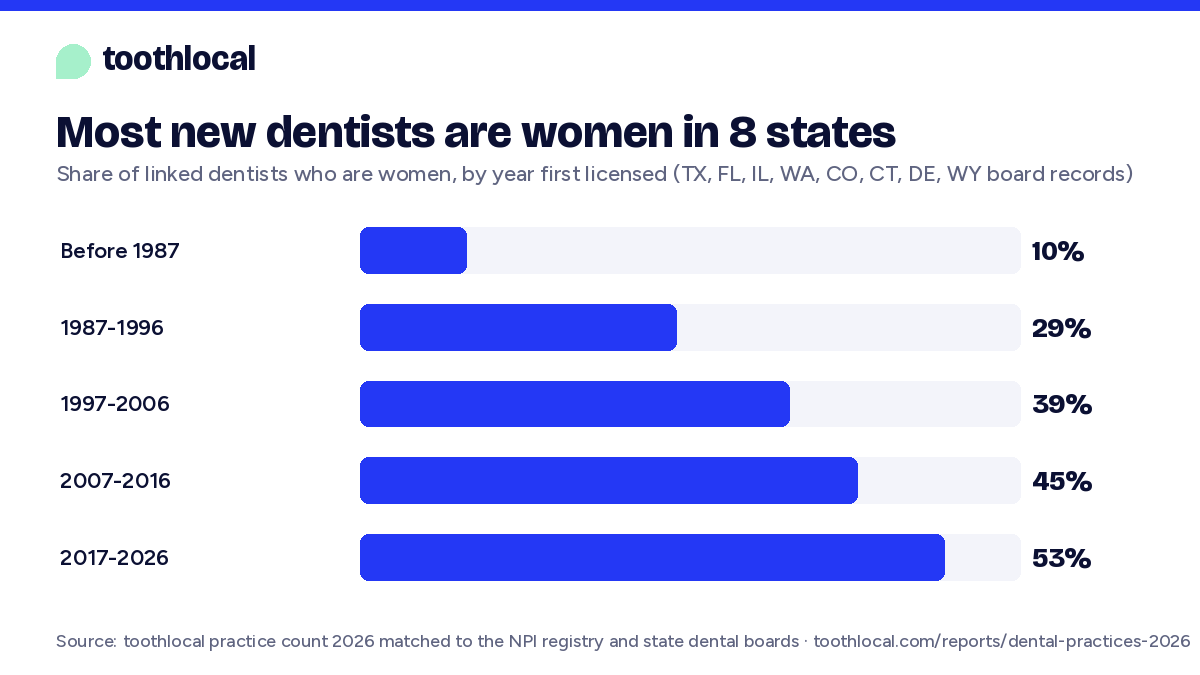
The ADA counts 39.4% of active dentists as women (2025); among the 162,960 dentists we could link to practices it's 36%, so our linked set runs a little short of women. The youngest license cohort looks very different from the oldest. In the eight states whose boards publish license dates, 10% of dentists first licensed before 1987 are women, against 53% of those licensed since 2017. Specialties differ widely: about half of pediatric dentists are women, but only 1 in 10 oral surgeons.
Dentists linked to practices by a phone and address or unique-name match in the NPI registry (CMS, September 2026), dentist taxonomy only. License years from the dental boards of Texas, Florida, Illinois, Washington, Colorado, Connecticut, Delaware and Wyoming (40,821 dentists).
In eight states, 1 in 6 practices is a solo practice whose dentist was licensed 35+ years ago
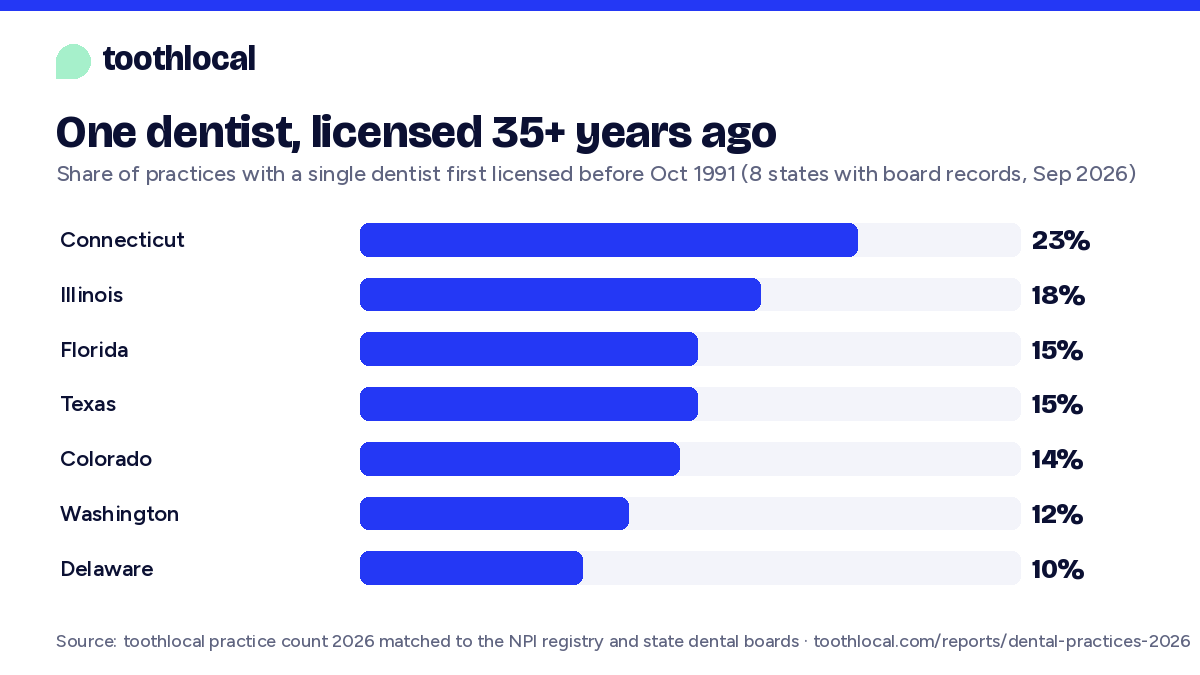
In Texas, Florida, Illinois, Washington, Colorado, Connecticut, Delaware and Wyoming, where boards publish when each dentist was first licensed, 16% of practices have a single dentist licensed before October 1991. A license date isn't a retirement date, and many of these dentists will keep working for years. It offers a snapshot of offices staffed by a single dentist with a long licensing history, where one person's plans will shape whether the practice carries on, takes on a partner, is sold or joins a group. Counting practices where every dentist was licensed 30 or more years ago, the share is 23%.
22,768 practices in TX, FL, IL, WA, CO, CT, DE and WY where every linked dentist has a board record. Other states don't publish license dates in bulk.
What practices offer, from their own websites
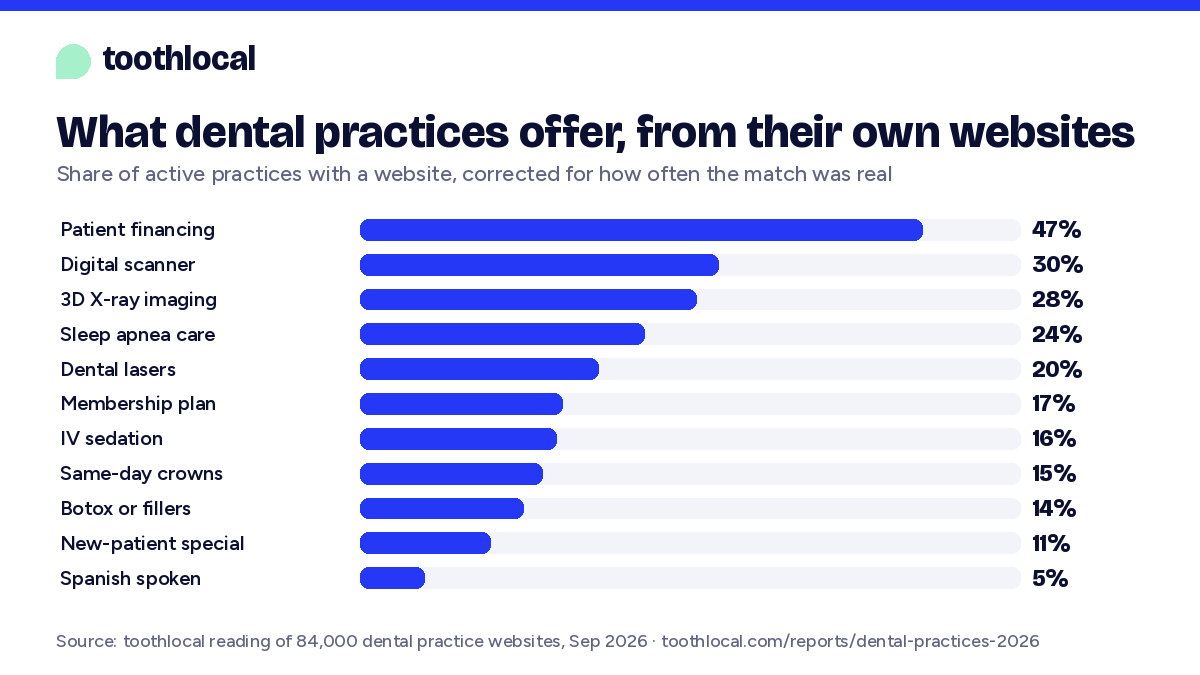
We read the websites of 121,555 active practices; these shares are of practices with a website, not of all practices. About 30% take digital scans instead of impression trays, 28% have 3D X-ray imaging and 15% make crowns in a single visit. Practice websites also advertise services well beyond teeth: 24% mention treating sleep apnea or snoring, and 14% offer Botox or fillers.
Shares of active practices with a website, corrected for how often a matching phrase really meant the practice offers it (a blind read of 40 sites per feature; accuracy for each is in the data file). Two features we tried, "out of network with all insurers" and "AI reads our X-rays", read right too rarely to publish.
Nearly half of practice websites offer patient financing
Of practices with a website, 47% offer financing through a lender such as CareCredit, and 17% sell their own membership plan: a yearly fee that covers cleanings and gives discounts, aimed at patients without insurance. 11% advertise a new-patient special. Each share is corrected by a blind read of the matching pages; the website chart above has all of them.
Half of practices have a dentist paid by a dental company, mostly in small sums
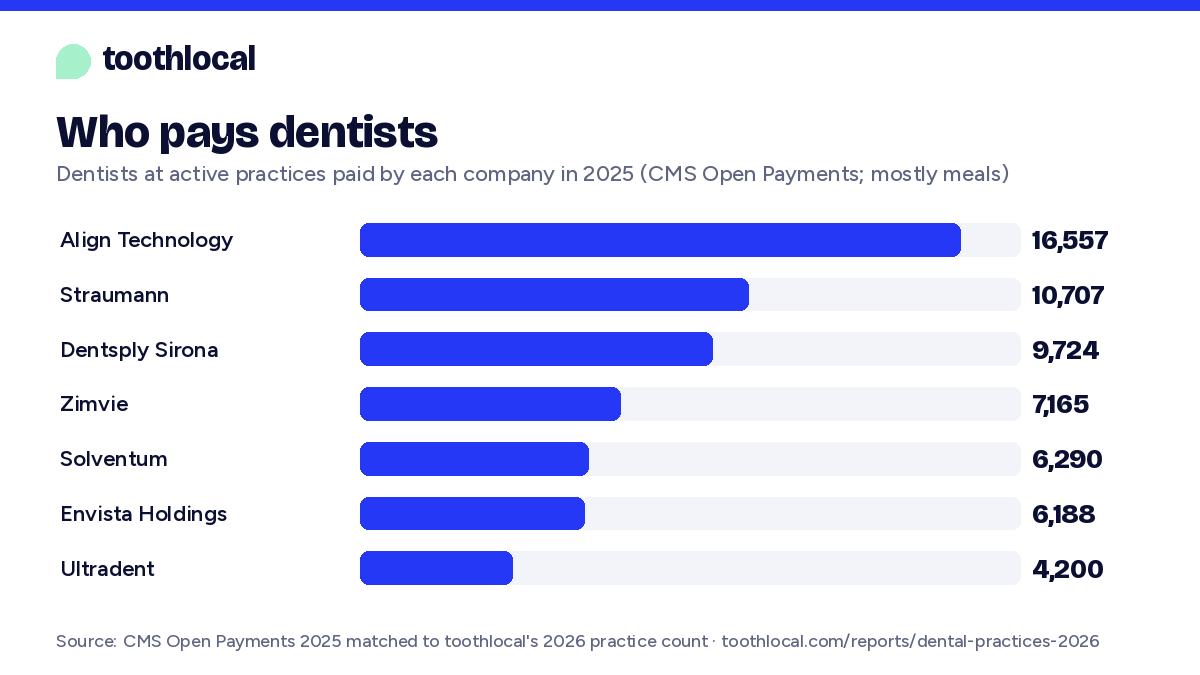
At 54% of practices linked to the NPI registry, at least one dentist received a payment from a dental manufacturer in 2025, by the federal Open Payments records. Most are small: the typical paid dentist received 83 dollars over the year, mostly meals at sales and training events. 16% of practices have a dentist paid by the maker of Invisalign, and 9% one paid by an implant company. Dentists in dental groups are paid more often (63% of practices, against 53%).
Open Payments counts meals, gifts, travel, education, consulting and speaking fees from manufacturers to named dentists. A payment is not evidence of any wrongdoing. Matched to practices through each dentist's NPI.
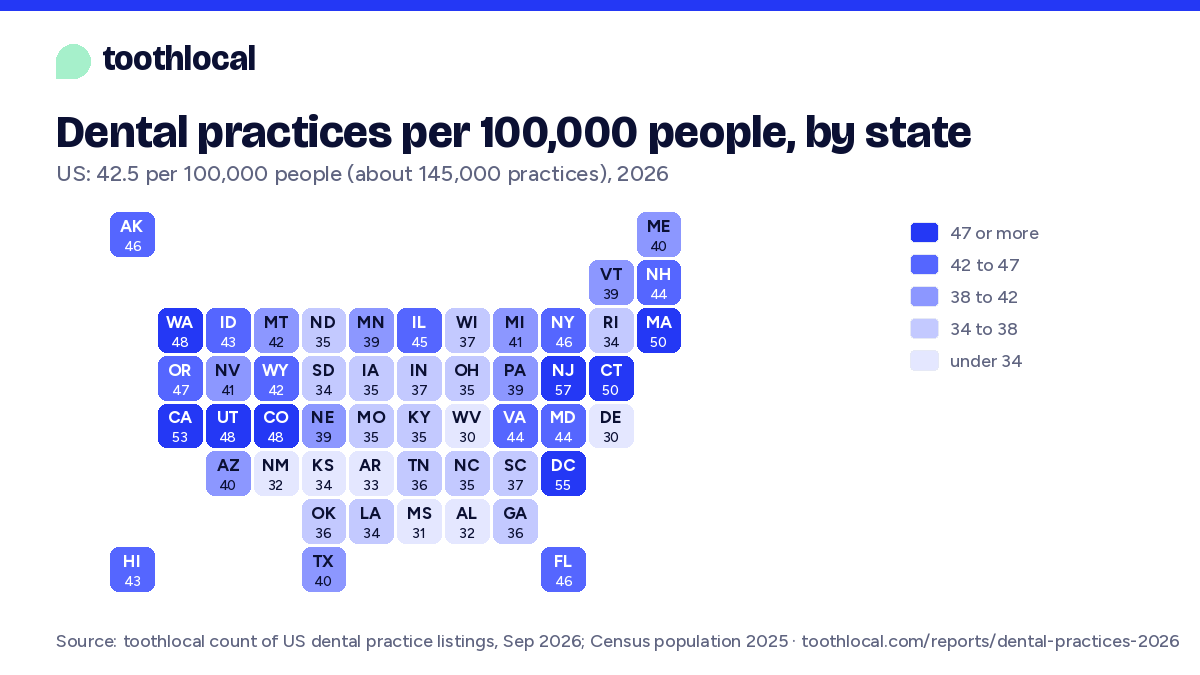
Dental practices per capita, state by state
Counted per capita, New Jersey has the most practices for its population, 56.8 per 100,000 people; West Virginia has the fewest, 30.0. Tap a state for a paragraph you can quote and a chart with its practices, Medicaid share, solo practices and women dentists.
How many orthodontists, oral surgeons and pediatric dentists?
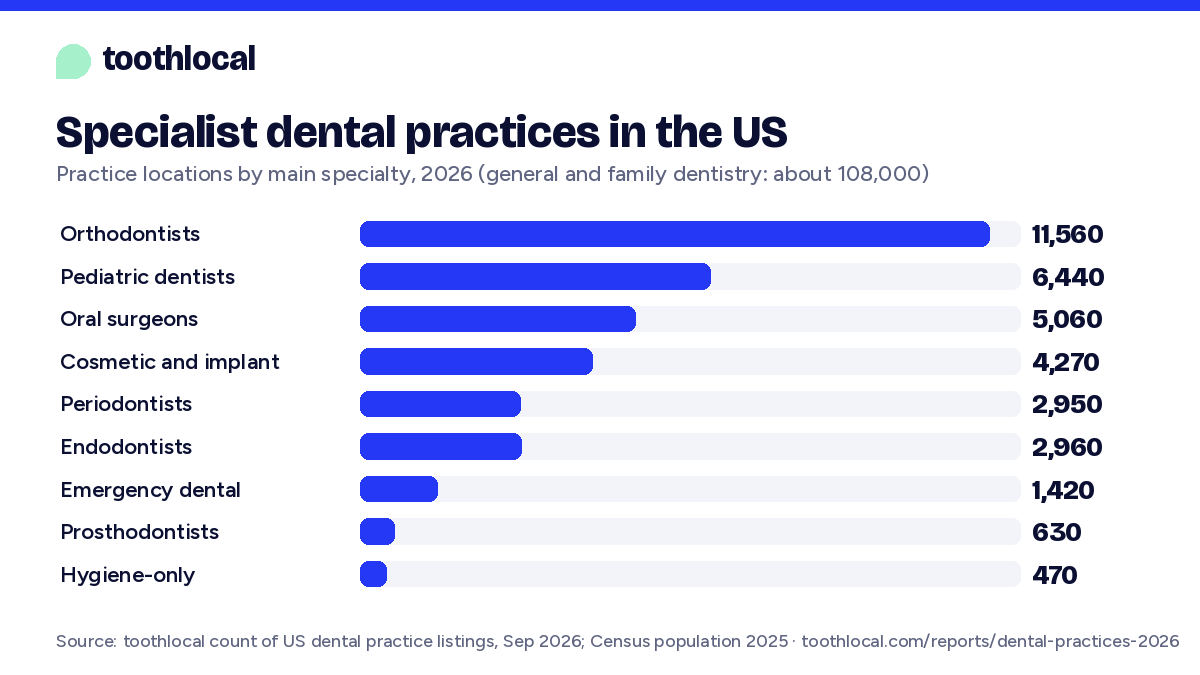
About 108,000 practices are general and family dentistry. Orthodontics is the biggest specialty, with about 11,600 practice locations, then pediatric dentistry (6,400) and oral surgery (5,100).
Practices by the specialty on their main listing, not specialists: one orthodontist can work at several locations. For the number of orthodontists, oral surgeons and other specialists as people, see How many dentists are in the US?
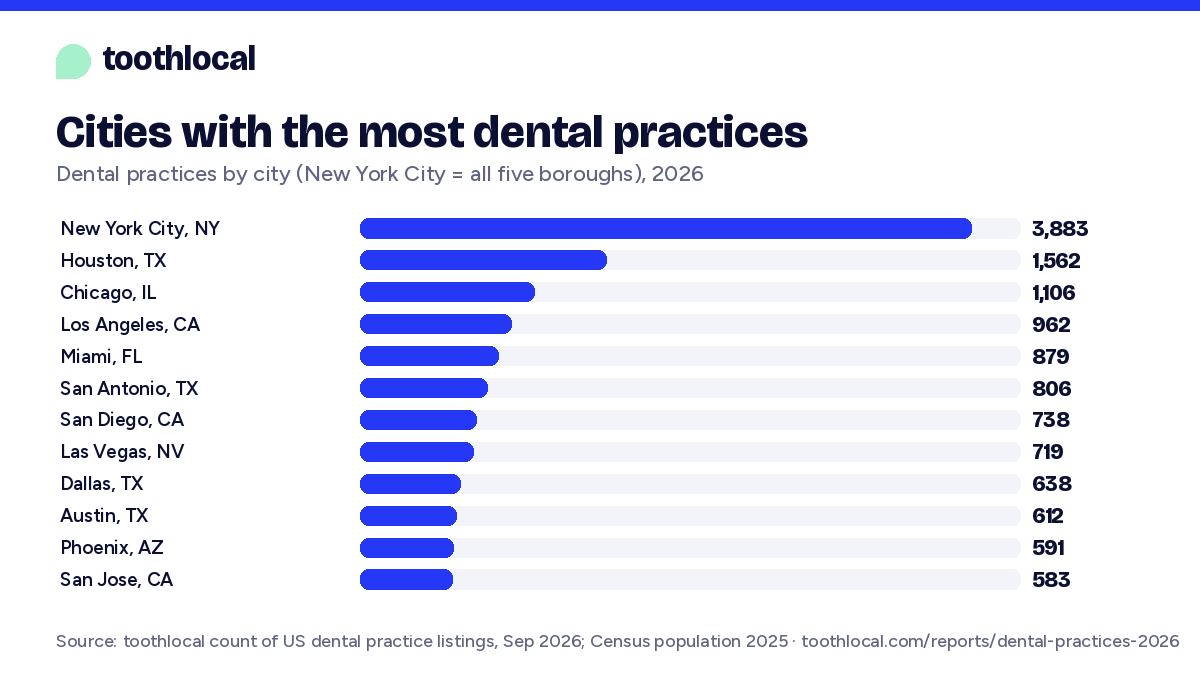
The cities with the most dental practices
New York City is one city across its five boroughs, by ZIP code. Other cities are as written on the listings, so a suburb with its own name counts on its own.
Questions people ask
- How many dental practices are in the US?
- About 145,000 active dental practices in 2026, by toothlocal's count of public practice listings in all 50 states and DC.
- How many dental practices are there per person?
- 42.5 per 100,000 people, or one for every 2,355 people.
- Which state has the most dental practices per person?
- New Jersey, with 56.8 per 100,000 people. West Virginia has the fewest, 30.0.
- How many dentists are in the US?
- 205,088 professionally active dentists in 2025 by the American Dental Association, 60.0 per 100,000 people. The NPI registry lists 275,954 individual dentists, including retired and non-practicing ones.
- How many orthodontists are in the US?
- About 10,600 practicing orthodontists by our estimate (13,722 in the NPI registry). They work at about 11,600 practice locations.
- How many oral surgeons are in the US?
- About 7,300 practicing oral and maxillofacial surgeons by our estimate (8,555 in the NPI registry).
- How many dental offices are in the US?
- About 145,000 active dental offices by toothlocal's 2026 count. The Census Bureau counted 135,665 offices of dentists with paid employees in 2023.
- Are dentists open on weekends?
- Mostly not. Of practices that publish their weekly hours, 20% list Saturday hours and 5% list Sunday hours; checked against practices' own websites, about 19% open on Saturdays. Dental groups list Saturday hours more often.
- How many dental practices are part of a dental group?
- About 16,300 (11%) were identifiable as part of a multi-location dental group of 5 or more offices on one website, run by about 1,627 groups. The other 89% were not identified as part of such a group; that includes practices whose owner we can't see. A shared website shows shared branding, not who owns the practice.
- What share of dentists are women?
- 39.4% of active US dentists in 2025, by the American Dental Association. In the 8 states with board license records, 53% of dentists first licensed since 2017 are women.
- How many dentists take Medicaid for children?
- 23% of active US dental practices are listed in the HHS Insure Kids Now directory as in a children's Medicaid or CHIP plan. A listing doesn't confirm an open appointment.
- When are dental practices open?
- Of practices that publish their weekly hours, 20% list Saturday hours and 5% list Sunday hours. 32% list no Friday hours, though checked against practices' own websites about 25% are closed on Fridays. Published hours can differ from when appointments are available.
- Is this the same as the number of dentists?
- No. The ADA counts 205,088 active dentists (2025), about 1.4 per practice.
How sure each number is
- Who did the reading. Judging whether two listings are one practice, and whether a sentence on a website means the practice offers something, was done by an AI model (Anthropic's Claude) working blind on samples. Our team chose the questions, set the rules and went through the results.
- The count. Of 300 random locations alone at their address, 95% were dental practices. At shared addresses the reader counted the separate practices (147 among 180 where 2 share; 170 among 210 where 3 share; 249 among 325 where 4-6 share; 283 among 406 where 7+ share). Next-door listings were the same practice 20% of the time for dentists' personal listings and 26% for offices. Each location is weighted by what the checks found. The range comes from 2,000 resamples of the checked items: it covers the uncertainty in the checks only, not practices without a listing or mistakes in the active rule.
- Places. 1,484 listings with no US address or map position are left out. Locations with a map position but no state were given the state of the practices around them. State figures add up to the national one, apart from rounding.
- Active. A written review since 21 September 2024, a website of its own, or a claimed listing. 61,372 locations had none and are left out.
- Linked records. NPI, board and payment figures use only strong matches (phone with ZIP or address, or a unique name). They cover 100,103 practices for the NPI registry and 22,768 for license dates.
- Hours. 180 listings checked blind against the practice's own website (details under Opening hours). The checked Friday figure is the one we lead with.
- Websites. Each feature's matches were read blind, 40 sites each; published shares are corrected by that accuracy. The data file shows each feature's accuracy and range.
- Against the Census. Matching an official count checks the total, not every finding below it. State counts track the Census Bureau's count of dental offices (correlation 0.994).
What this can't tell you
- Practices without a listing aren't counted, including some clinics inside hospitals, schools and the military.
- The active rule drops some open but silent practices and keeps some closed ones with a live website.
- Websites say what practices advertise, not what every patient gets. A practice that doesn't mention something may still offer it.
- License years cover eight states; other states may differ.
- Linked dentists are the ones we could match with confidence. They run a little short of women against the ADA's national figure.
- Dental groups are defined by a shared website, not by who owns the practice.
Sources and how we counted
- Practice listings
- Public business listings of US dental practices and dentists, collected by toothlocal in September 2026 across all 50 states and DC. Listings marked closed are not included. Listings sharing a phone number, house number and ZIP code are one location; call-routing listings are removed.
- Dentists
- NPI registry (Centers for Medicare & Medicaid Services), September 2026: individual dentists linked to practices.
- License years
- Public license files of the dental boards of Texas, Florida, Illinois, Washington, Colorado, Connecticut, Delaware and Wyoming, linked by NPI.
- Children's Medicaid and CHIP
- Insure Kids Now (US Department of Health and Human Services), state data updated July 2026.
- Industry payments
- CMS Open Payments, general payments for program year 2025.
- Websites
- About 84,000 practice websites read in September 2026; feature phrases checked by a blind read.
- Population and benchmarks
- Census Bureau state estimates for 1 July 2025; County Business Patterns 2023, offices of dentists (NAICS 621210, 135,665 establishments); ADA Health Policy Institute, 205,088 active dentists in 2025, 39.4% of them women.
- What you can check
- Every figure on this page is in the data files. The listings, websites and linked records themselves aren't published, and no practice or dentist is named.
- About toothlocal
- toothlocal is a free dentist finder. We don't sell placement: no practice can pay to change where it appears or what we show. About us, How we know. Something wrong? Tell us.
Use the charts and data
Everything on this page is free to use with a credit and a link. Pick a state above for a ready-made paragraph and chart. We update this count every year at the same address. Questions about the data, or a cut of it for your story: use our contact form and the research team will reply.
The key figures, ready to quote
There are about 145,000 active dental practices in the US (142,142 to 148,282 by our checks), 42.5 per 100,000 people, from toothlocal's count of practice listings, September 2026.
Of US dental practices that publish their weekly hours, about 80% list no Saturday hours and 5% list Sunday hours. 32% list no Friday hours; checked against a sample of practices' own websites, about 25% are closed on Fridays.
About 16,300 US dental practices (11%) were identifiable as part of a multi-location dental group (5 or more offices on one group's website); the other 89% were not identified as part of such a group.
The US has about 205,088 professionally active dentists (ADA, 2025); by toothlocal's estimate about 10,600 are orthodontists and 7,300 oral surgeons.
Among 100,103 US dental practices linked to dentist records (NPI registry), 58% had one identified dentist and 18% had three or more.
In the 8 states with board license records, 53% of dentists first licensed since 2017 are women, against 10% of those licensed before 1987.
In the 8 states with board records, 16% of dental practices are run by a single dentist first licensed 35 or more years ago.
23% of active US dental practices are listed in the federal Insure Kids Now directory as in a children's Medicaid or CHIP plan, from 7% in one state to 56% in another.
Of US dental practices with a website, 47% offer patient financing and 17% sell an in-house membership plan.
54% of dental practices linked to the NPI registry have a dentist who received a payment from a dental manufacturer in 2025, mostly meals; the typical paid dentist received 83 dollars.
For comparison, the Census Bureau counted 135,665 dental offices with employees in 2023, and the ADA counts 205,088 active dentists (2025).
Cite
Charts
Social card
Data files
- By state counts, per 100,000 people, specialties, groups, hours, listing details, Census comparison
- By specialty 12 practice types
- By city the 60 cities with the most practices
- Opening hours days, evenings, Fridays, hours a week
- What practices list services, payment, access, ownership
- Dental groups practices in identified multi-location groups vs the rest: counts, group sizes, side-by-side comparison with each row's base, by specialty and state
- What practices offer (websites) 11 features, with blind-read accuracy
- Dentists dentists by specialty, practice size, women by specialty and license year, long-serving solo dentists
- Industry payments companies and payment types, 2025
- The checks the three blind checks behind the estimate
Other reports
- Dental chains vs independent dentists, 2026 October 2026
- AI Review Index 2026 October 2026
Find a dentist on what patients actually say
toothlocal reads every review, each practice's own website and the public license records, so you can choose on facts, not ads.
Find a dentist near you