Pressure to buy: What patients report at private equity-backed dental chains
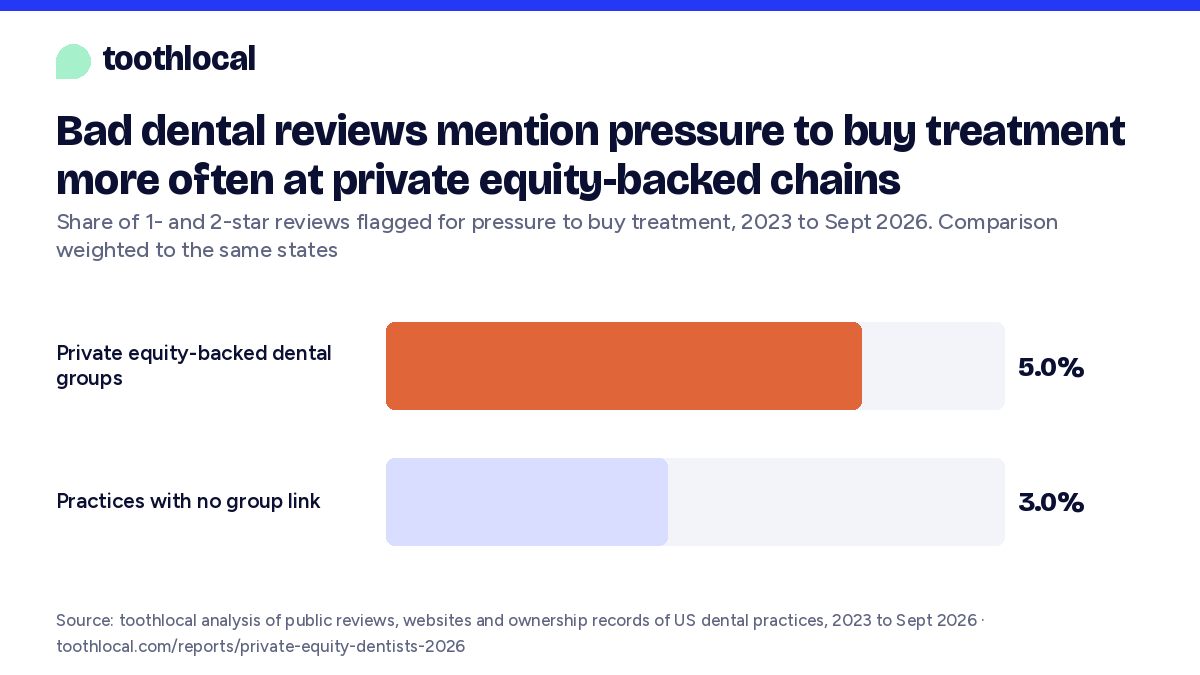
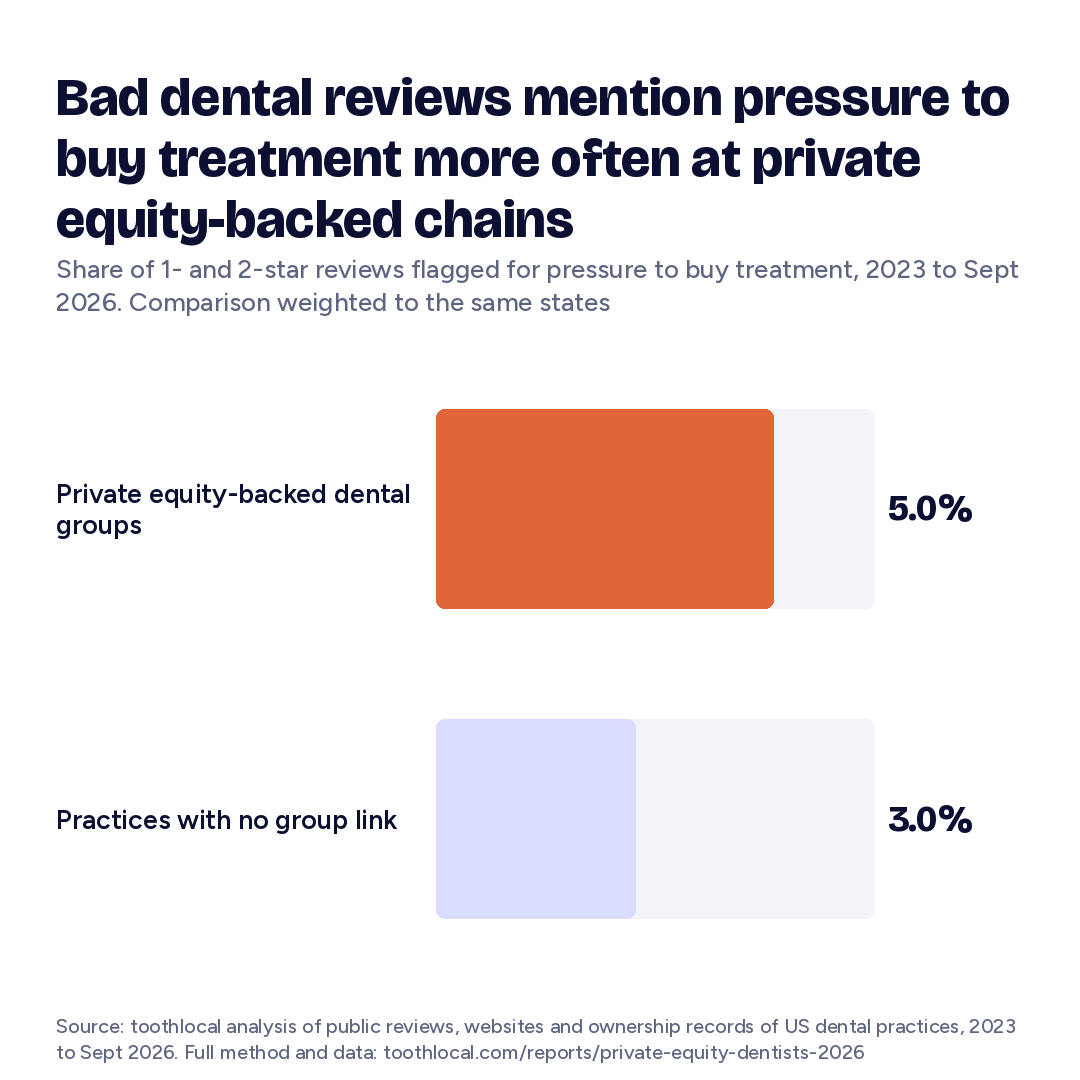
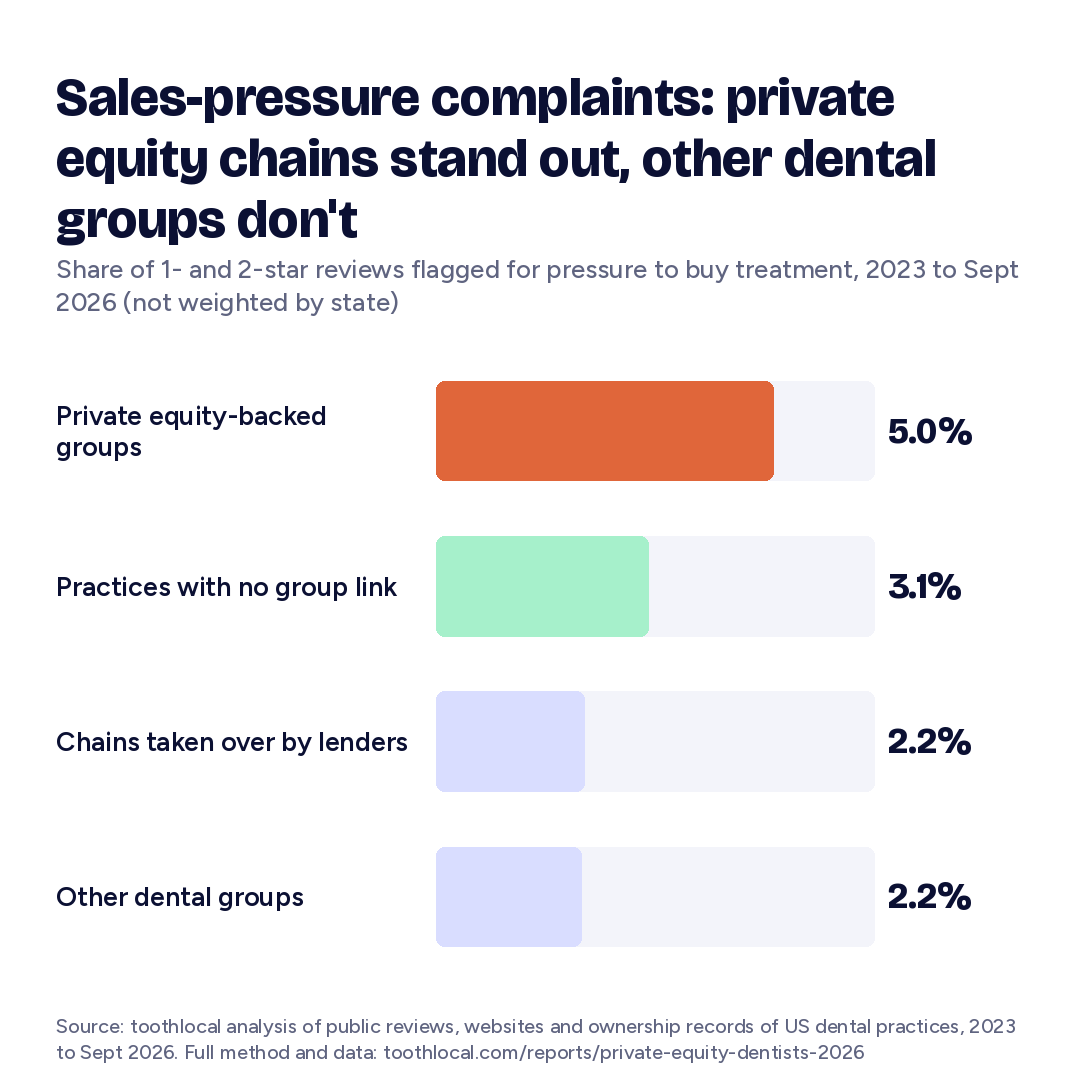
In one- and two-star reviews, our search patterns flagged pressure to buy treatment in 5.0% at dental groups backed by private equity, against 3.0% at practices with no group link in the same states. The gap is uneven: it comes mostly from a few large chains.
of low-rated reviews flagged for pressure to buy treatment: private equity-backed groups against practices with no group link, same states. About 2 percentage points apart, or 1.7 times.
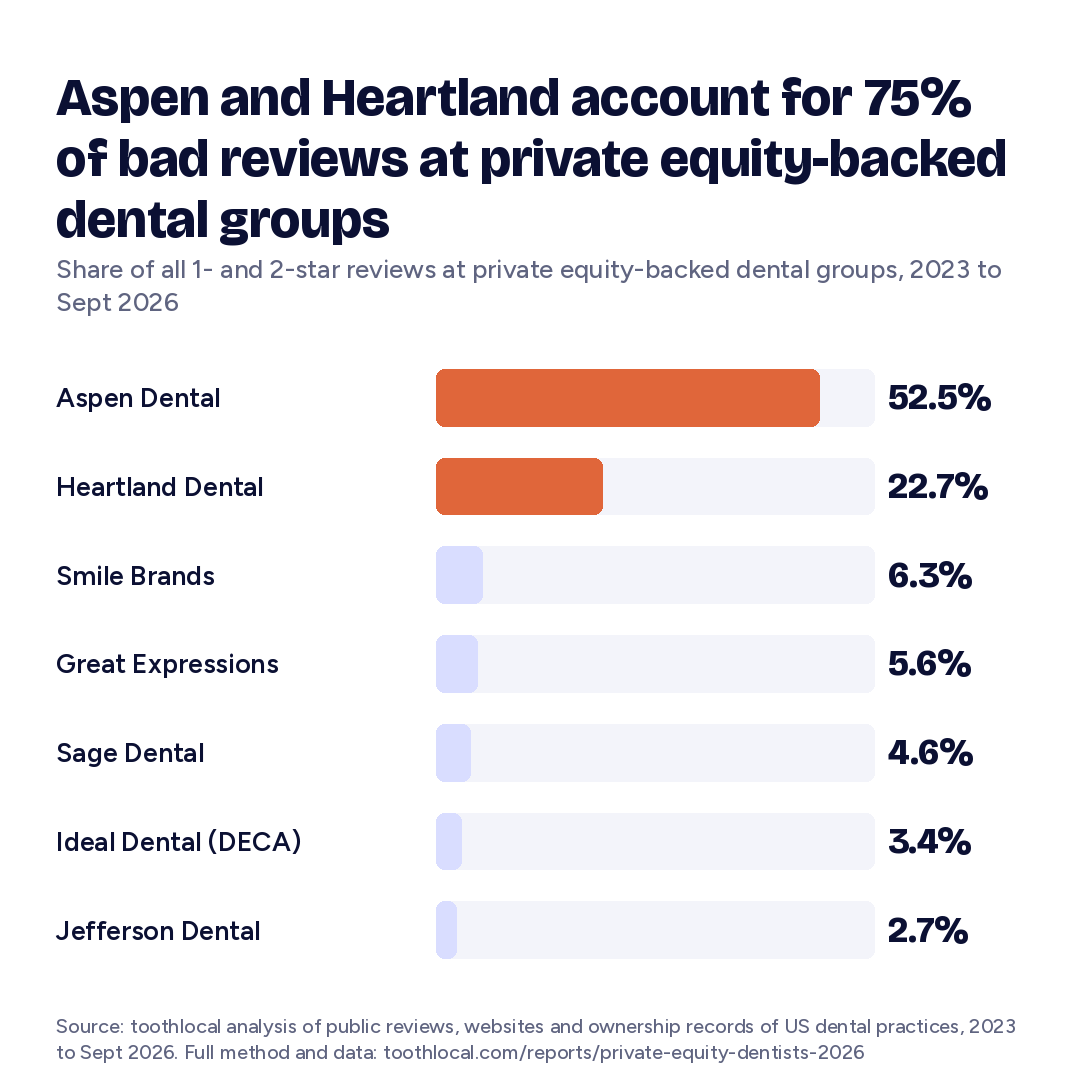
the same comparison without the two biggest groups, Aspen Dental and Heartland Dental, which wrote 75% of the low-rated reviews
What dissatisfied reviewers wrote
A dental office's name may tell you little about the organization supporting it. Some practices use a national brand; others keep a local name while a larger group runs the business side. We linked practices to dental groups, researched each group's reported financial backers, and compared what unhappy patients wrote.
- The sample. Written one- and two-star reviews from January 2023 to September 2026: 130,287 at practices linked to groups currently backed by private equity, and 451,928 at practices with no group link.
- The comparison. Practices with no group link we could identify. Their independence isn't confirmed, and the comparison rate is weighted to the states the groups' reviews come from, not matched practice by practice.
- The limits. Group status is as of November 2026 and applied to reviews back to 2023. Complaints are found by search patterns, checked by an AI model on samples, with no human check yet. This measures what low-rated reviews say, not how many patients felt pressured, whether treatment was unnecessary, or whether private equity changed any practice.
About two percentage points within bad reviews
At practices linked to private equity-backed groups, 6,513 of 130,287 low-rated reviews matched our pressure-to-buy pattern: 5.0%. At practices with no group link, weighted to the same states, it was 3.0%. That's 2.1 points higher (95% range 1.9 to 2.2), or 1.7 times (range 1.63 to 1.76). Comparing within each state and specialty, such as general dentists with general dentists, gives 1.6 times.
Mentions that treatment felt unnecessary, or that the price was too high, also run higher. Others don't: surprise bills are about level, and rude front-desk staff and quality slipping over time come up less often.
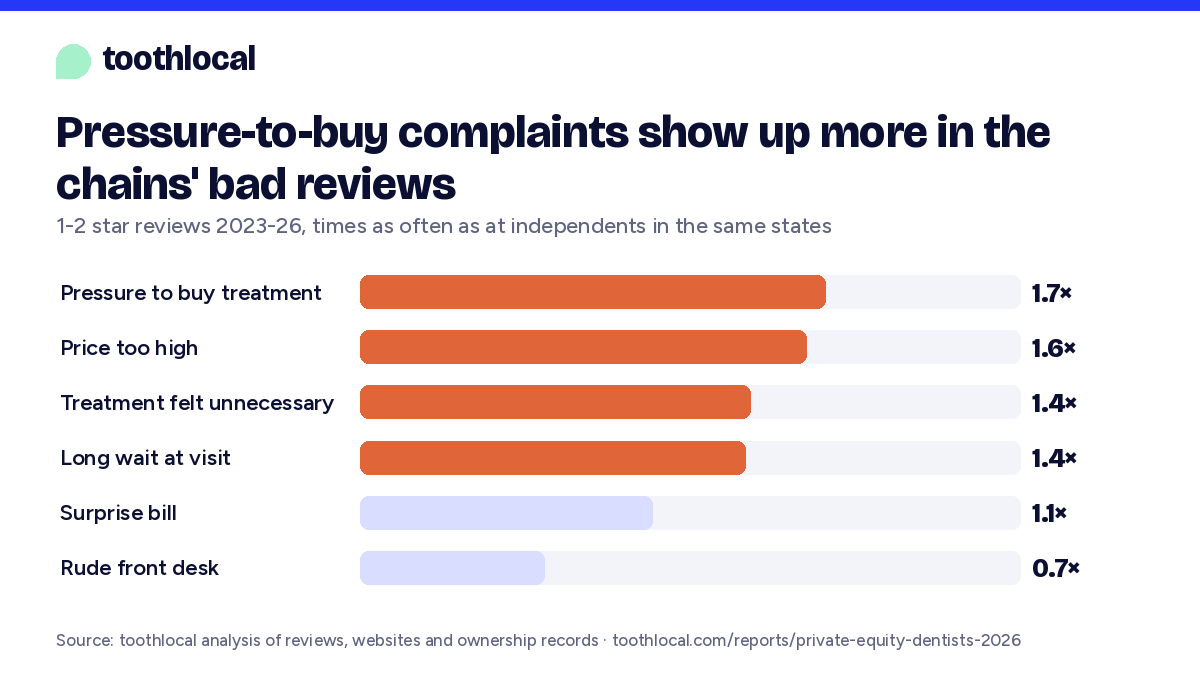
| Flagged in low-rated reviews | Private equity-backed groups | No group link, same states | Times as often |
|---|---|---|---|
| Pressure to buy treatment | 5.0% | 3.0% | 1.7× |
| Treatment felt unnecessary | 4.1% | 2.9% | 1.4× |
| Price too high | 2.0% | 1.2% | 1.6× |
| Long wait past the appointment | 6.4% | 4.5% | 1.4× |
| Surprise bill | 2.2% | 2.1% | 1.1× |
| Quality slipped over time | 0.8% | 1.2% | 0.7× |
| Rude front desk | 3.7% | 5.5% | 0.7× |
Share of one- and two-star written reviews flagged by each complaint pattern; some flags are false matches and some complaints are missed (see Checks). "Same states" is the no-group-link rate in each state, averaged by how many of the groups' low-rated reviews come from that state. The 95% ranges come from resampling practices, so they allow for reviews of the same office being alike. A review can match more than one pattern.
How this fits our October chains report
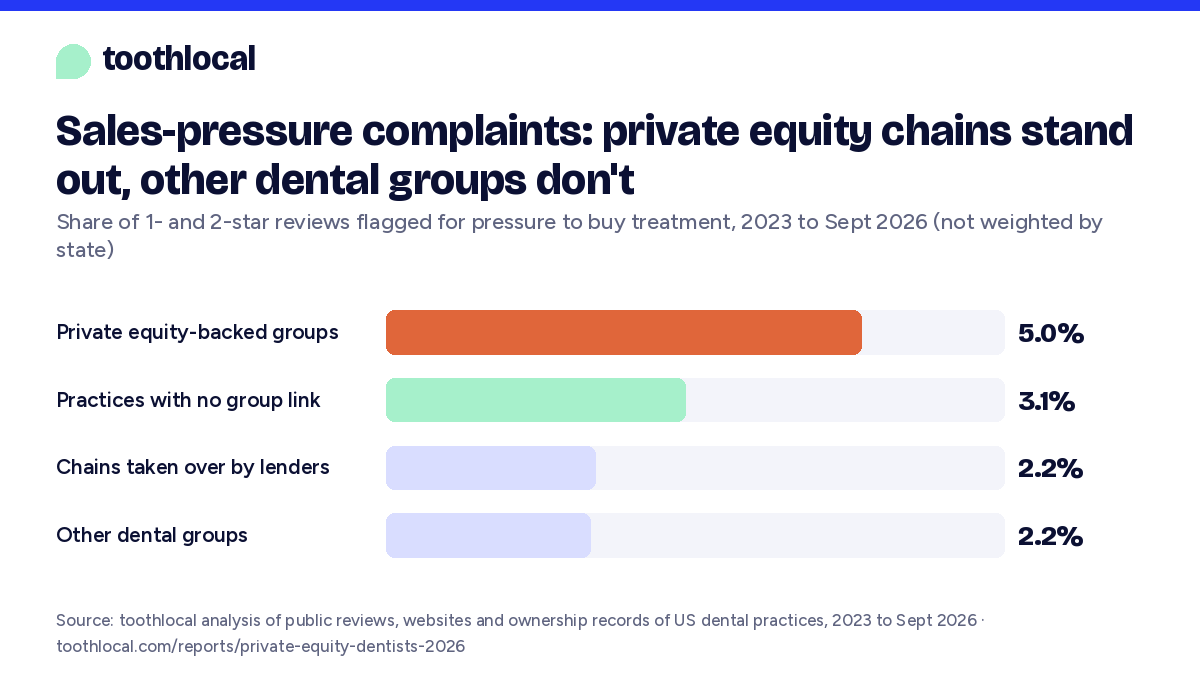
Our October report found pressure complaints took about the same share of bad reviews at chains as at independent practices. Both hold. Dental groups without private equity backing sit below practices with no group link (2.2% against 3.1%), and all groups pooled come out about level (1.0 times). The October report also counted practices that keep a local name, many of them Heartland-supported, as independent; here they're linked to their group.
The result varies sharply by group
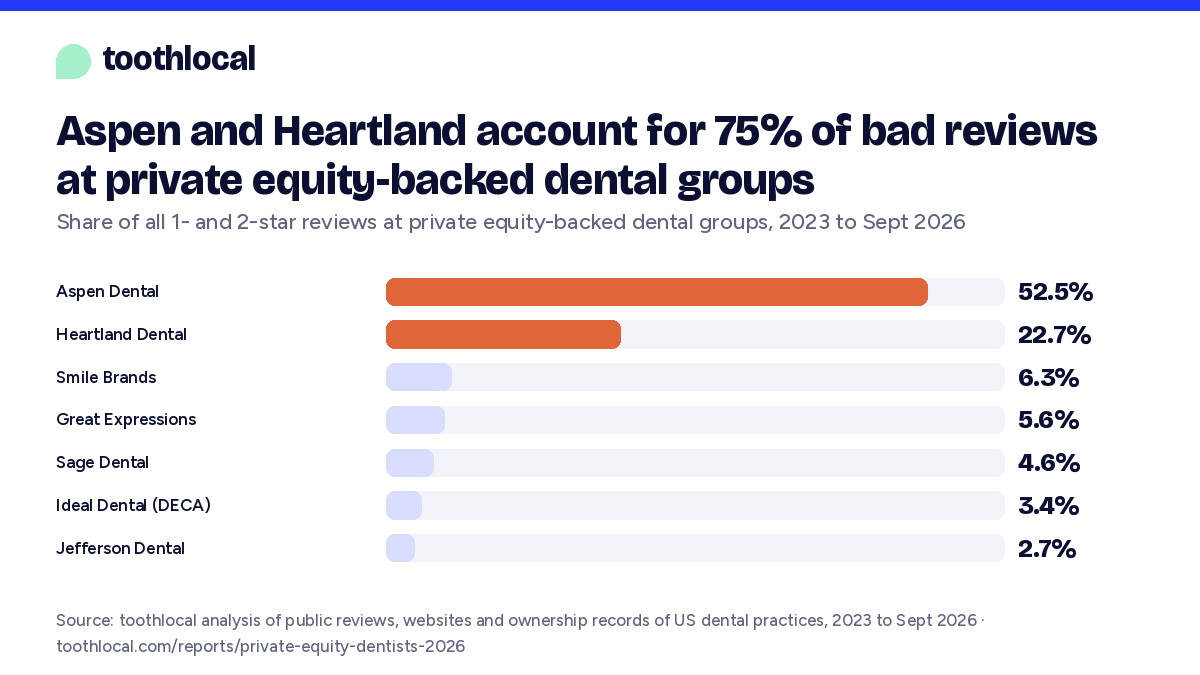
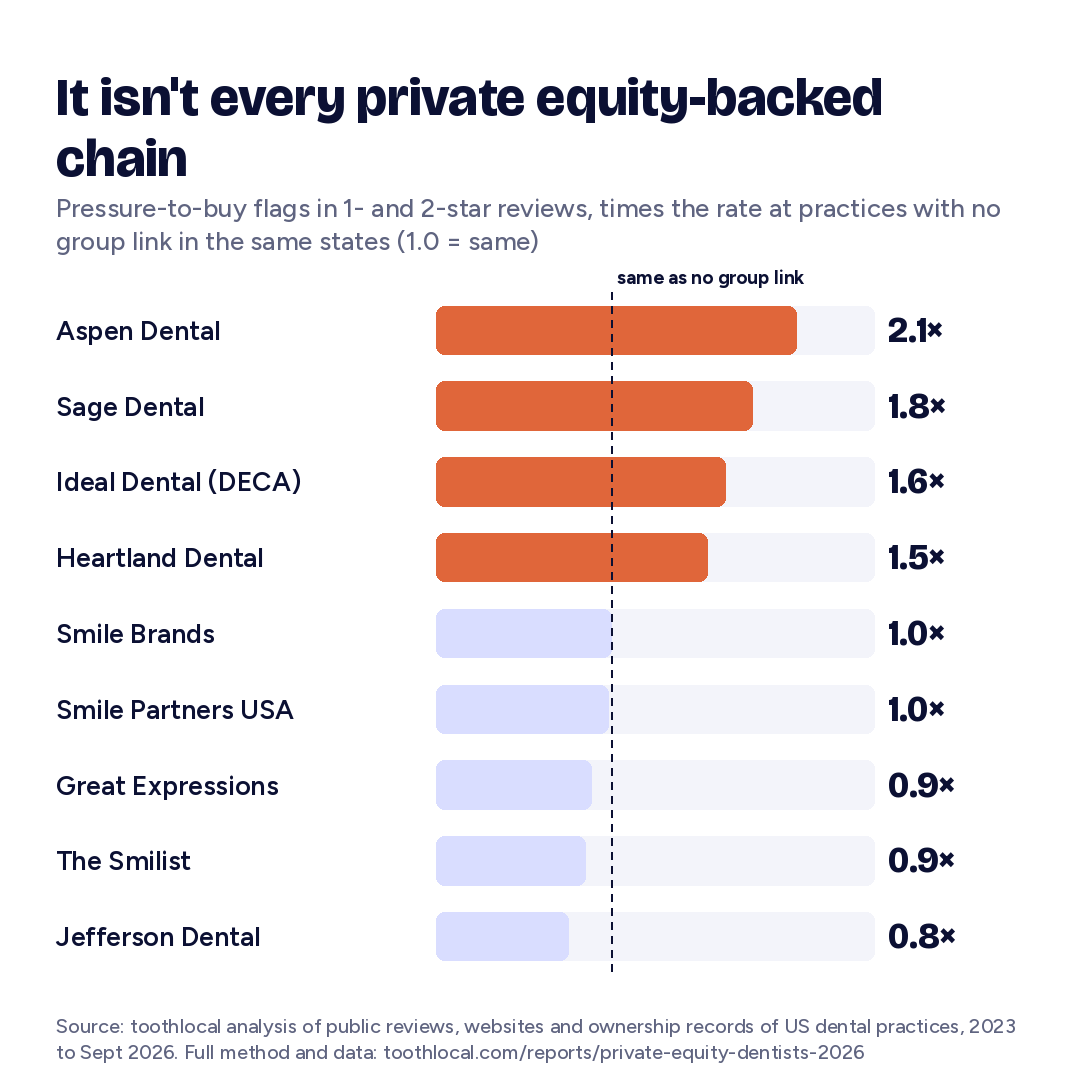
Aspen Dental accounts for 52% of the private equity groups' low-rated reviews, and its pressure rate is about twice its comparison (range 1.96 to 2.15 times). Heartland Dental, with 23%, is about 1.5 times (range 1.44 to 1.67). Sage Dental and Ideal Dental (DECA) also run high. Smile Brands is level, and Great Expressions, Jefferson Dental, The Smilist and Smile Partners USA are at or below their comparisons. Without Aspen the overall figure falls to 1.4 times; without Aspen and Heartland, to 1.2. Ownership alone doesn't explain the pattern, and these aren't rankings of clinical quality.
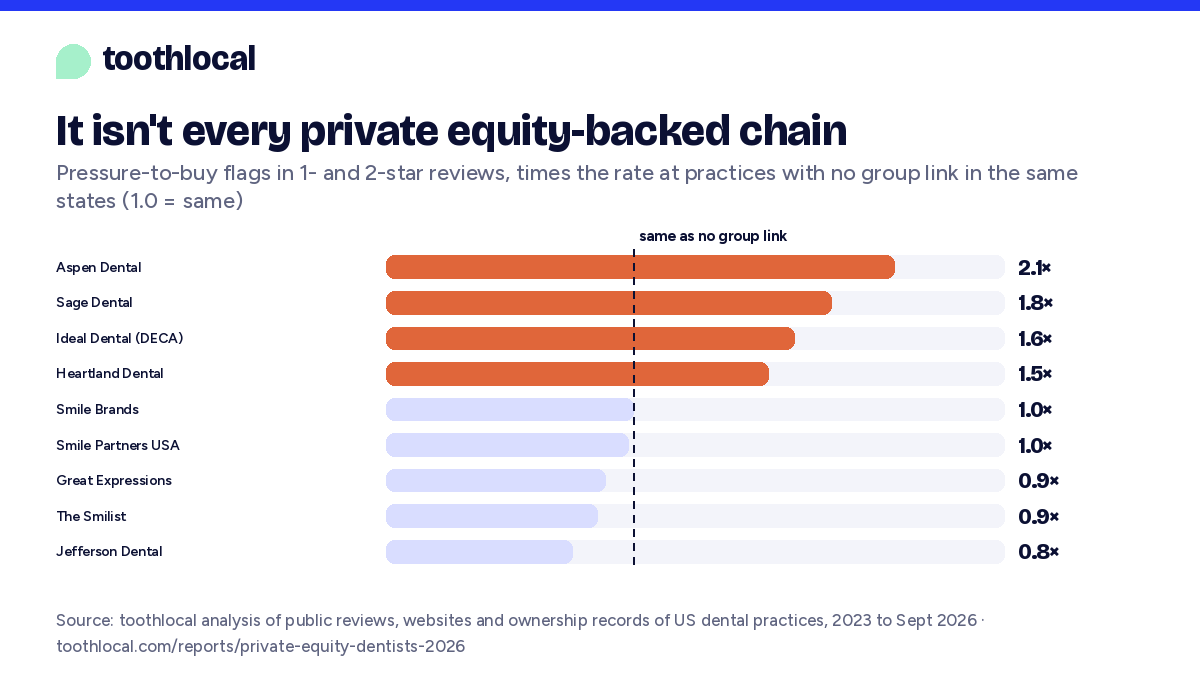
| Group | Backing | Locations | Low-rated reviews | Pressure flagged | Comparison | Times as often |
|---|---|---|---|---|---|---|
| Aspen Dental | private equity | 1,226 | 68,336 | 5.5% | 2.7% | 2.1× |
| Heartland Dental | private equity | 2,007 | 29,525 | 4.7% | 3.1% | 1.5× |
| Sonrava (Western Dental, Brident) | lender-owned (ex-PE) | 391 | 20,183 | 2.5% | 4.4% | 0.6× |
| Affordable Care | lender-owned (ex-PE) | 501 | 13,384 | 1.8% | 2.7% | 0.7× |
| Smile Brands | private equity | 467 | 8,260 | 3.5% | 3.5% | 1.0× |
| Great Expressions | private equity | 285 | 7,312 | 2.7% | 3.1% | 0.9× |
| Sage Dental | private equity | 167 | 6,033 | 6.6% | 3.7% | 1.8× |
| Ideal Dental (DECA) | private equity | 167 | 4,445 | 5.7% | 3.5% | 1.7× |
| Coast Dental | not PE (founder-owned) | 128 | 4,245 | 5.6% | 3.8% | 1.5× |
| Comfort Dental | not PE (franchise, dentist-owned offices) | 174 | 3,898 | 1.4% | 3.3% | 0.4× |
| Jefferson Dental | private equity | 76 | 3,549 | 2.7% | 3.6% | 0.8× |
| Advantage Dental | not PE (insurer-owned: DentaQuest / Sun Life) | 82 | 1,553 | 0.5% | 2.9% | 0.2× |
| The Smilist | private equity | 95 | 1,312 | 2.4% | 2.9% | 0.9× |
| Smile Partners USA | private equity | 72 | 707 | 2.5% | 2.6% | 1.0× |
Groups with at least 500 one- and two-star reviews and confirmed backing. Comparison: practices with no group link in the same states as the group's reviews. Smaller groups' figures are less certain. Coast Dental, founder-owned, also runs above its comparison, so a high figure isn't unique to private equity. Lender-owned groups are the chains whose lenders took control in 2026; their reviews mostly predate that.
About 1 in 9 reviews of private equity-backed chains is 1 or 2 stars
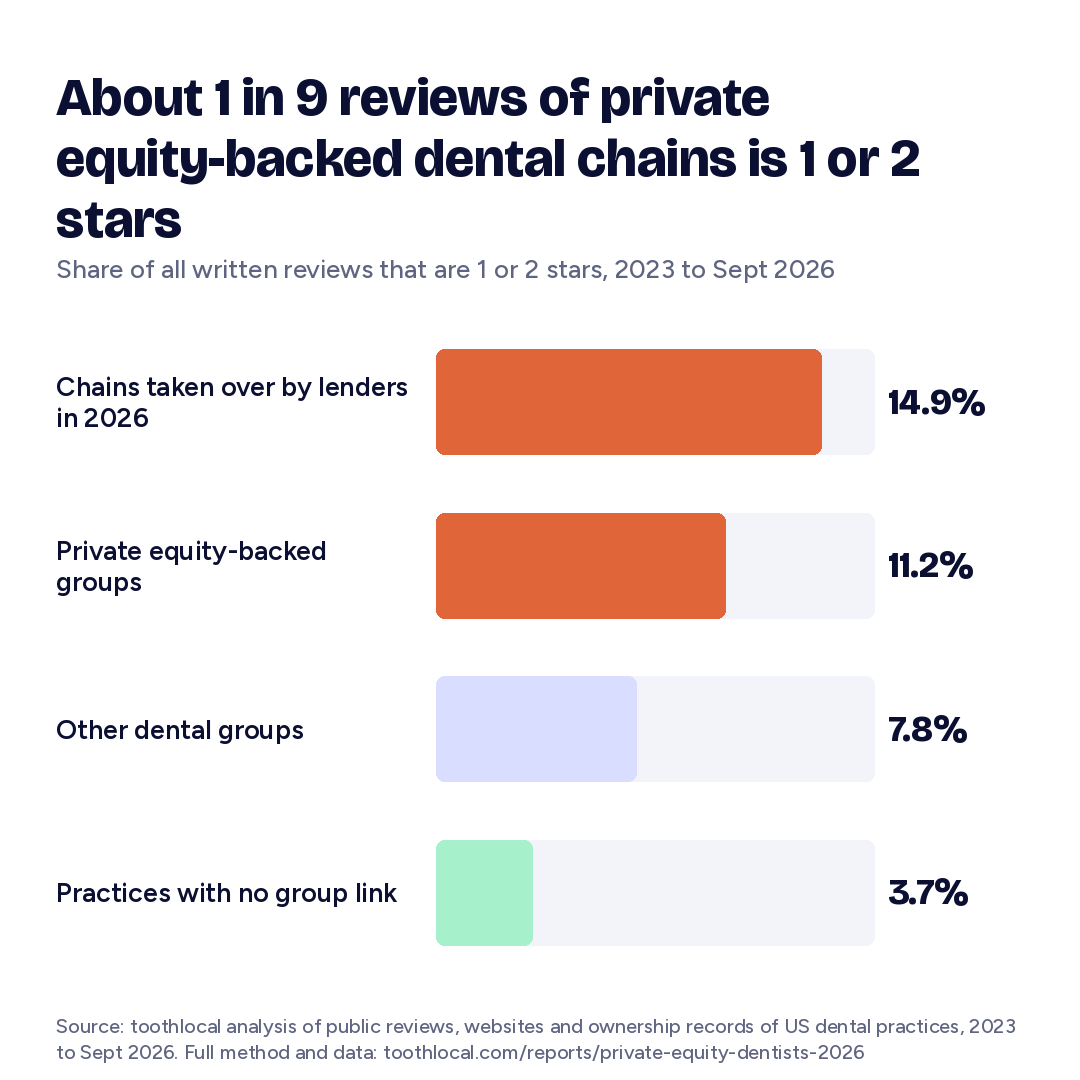
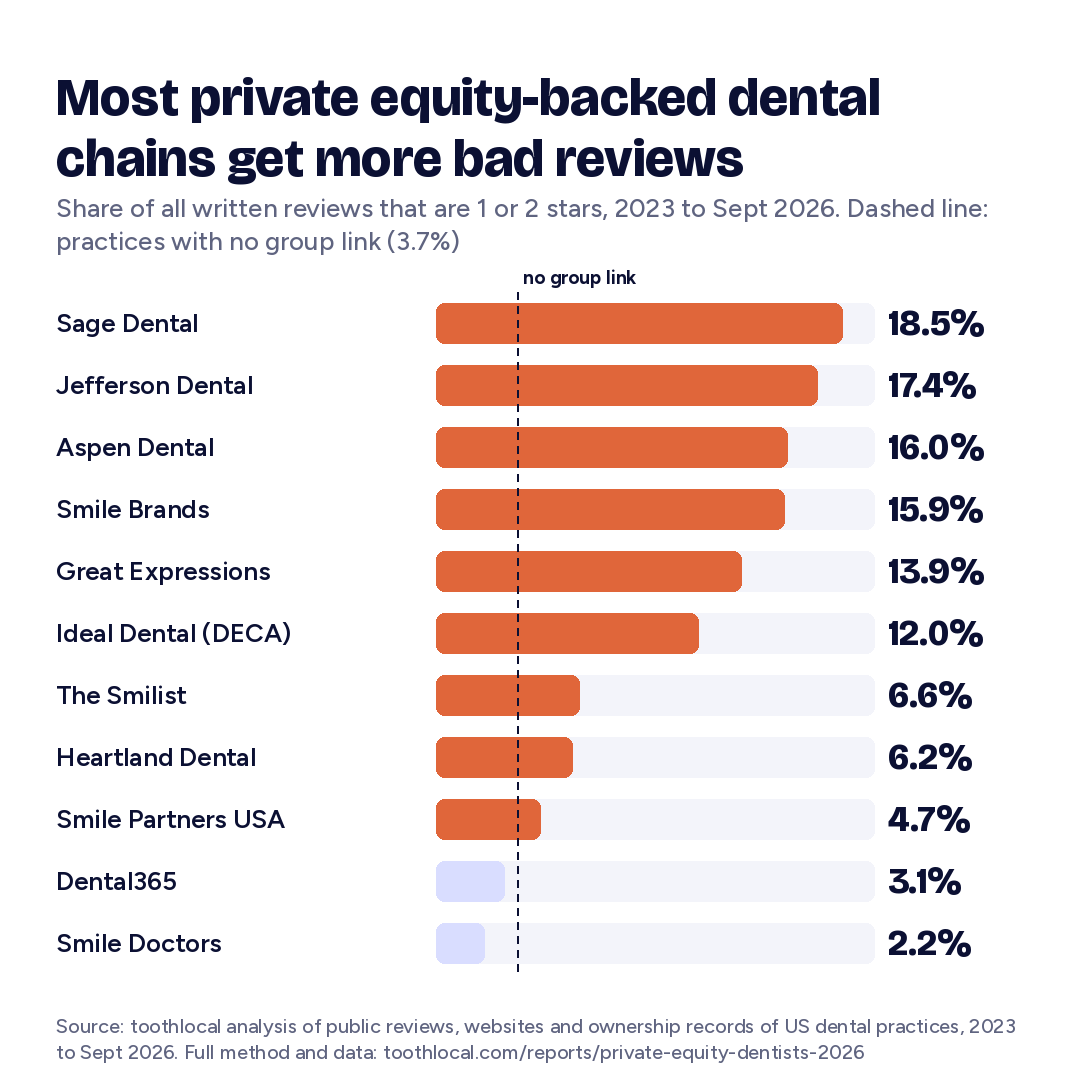
Looking at all written reviews, not just the bad ones: 11.2% of reviews at private equity-backed groups are one or two stars, against 3.7% at practices with no group link in the same states, about 3.1 times as many. Other dental groups sit between (7.8%), and the chains taken over by lenders are highest (14.9%).
Most private equity-backed chains are well above practices with no group link, but not all: Heartland Dental is at 6.2%, and Dental365 and Smile Doctors are below.
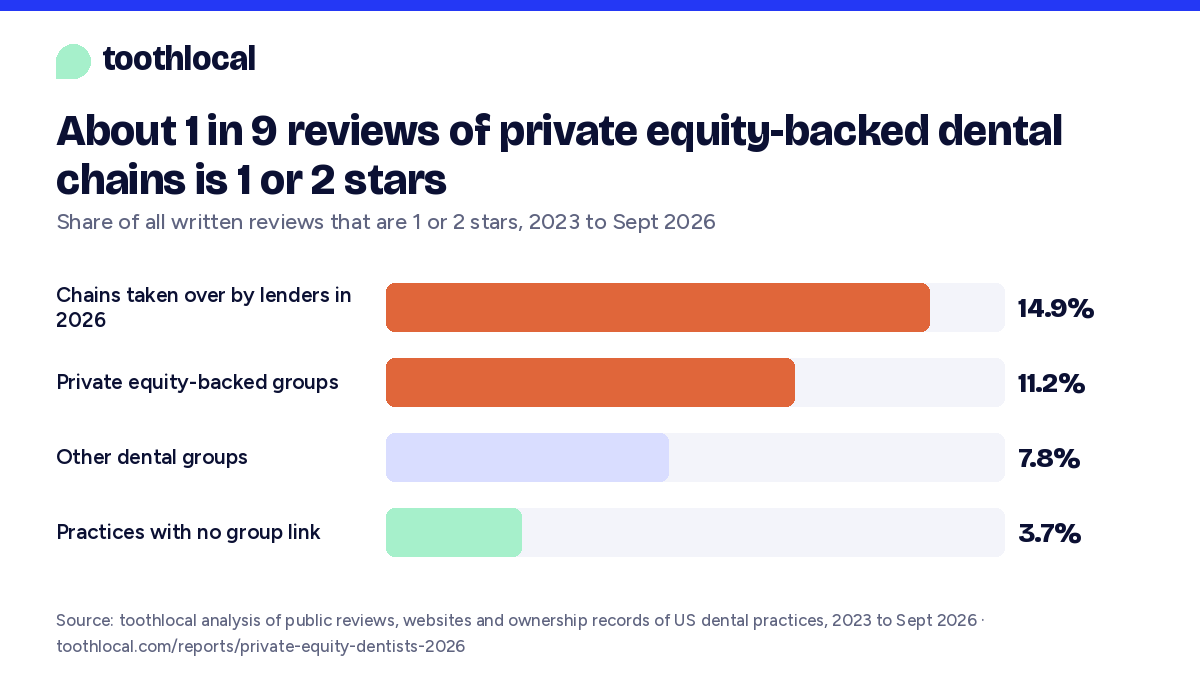
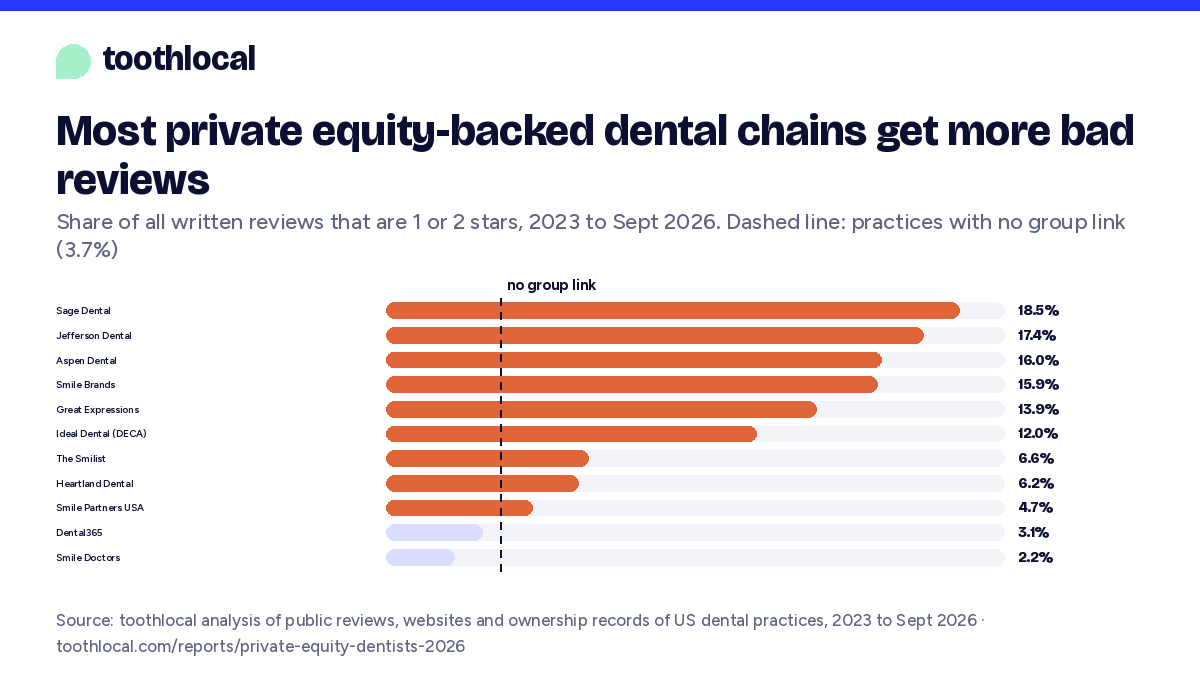
Share of written reviews from January 2023 to September 2026 that are one or two stars. Practices differ in how actively they ask happy patients for reviews, which raises or lowers this share, so it says more about the mix of reviews than about care.
A local practice name may not show its group
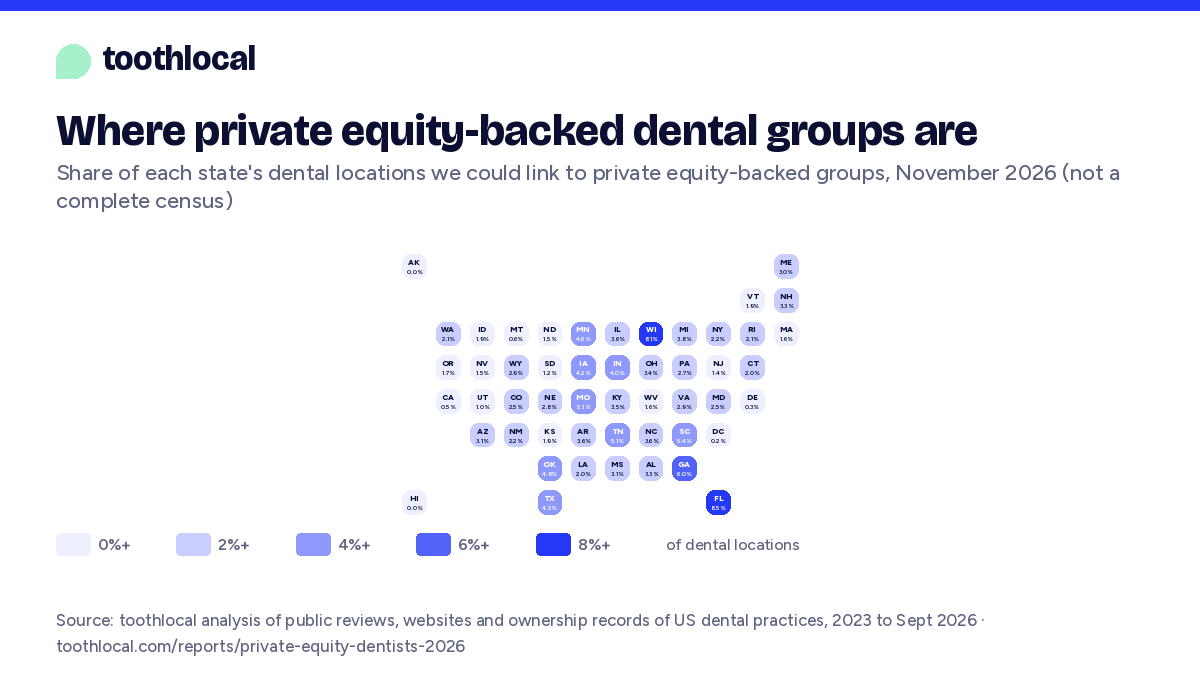
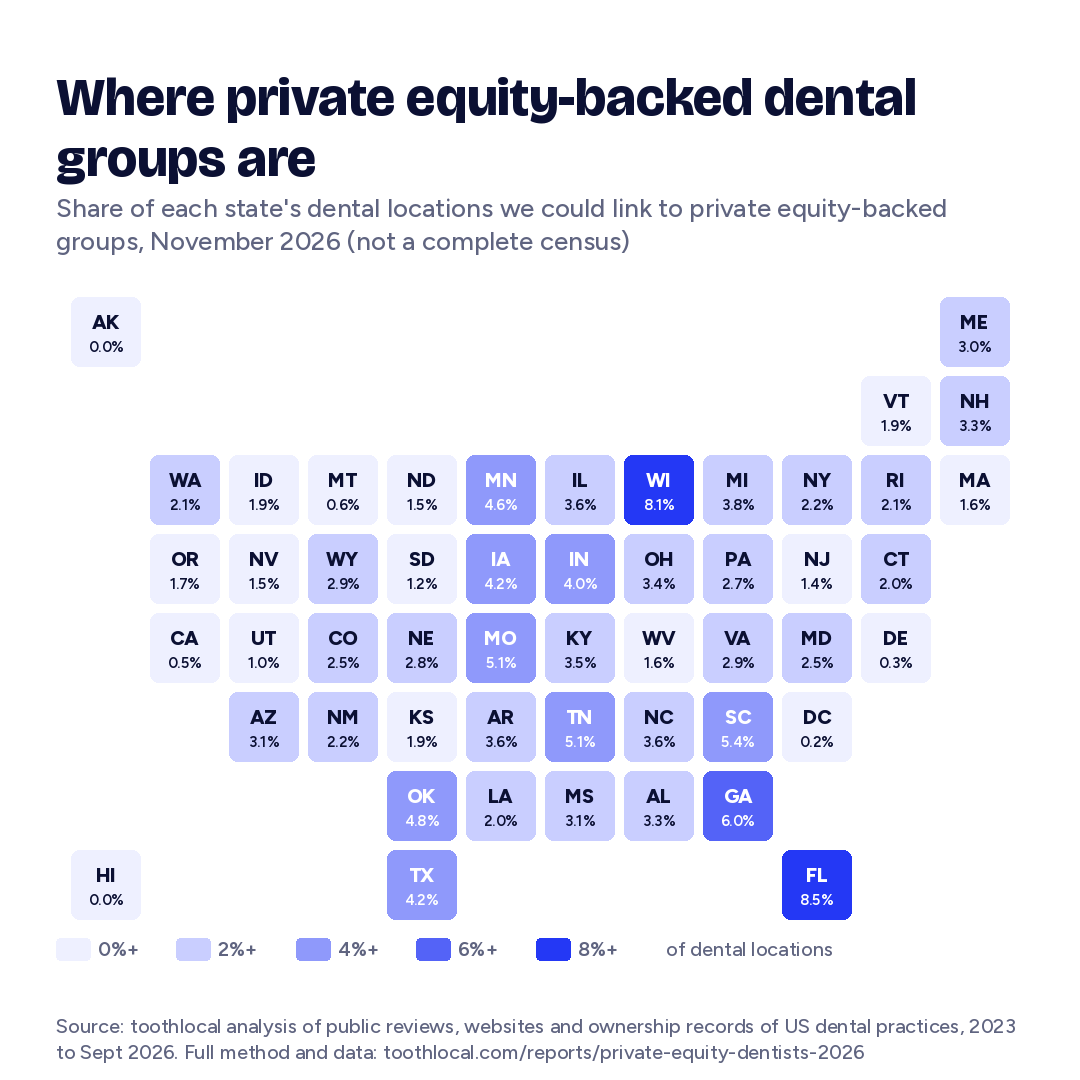
We could link about 4,800 US dental locations to groups backed by private equity, and about 900 to chains their lenders took over in 2026. That covers the groups we could identify and confirm, not every private equity-backed practice in the country.
A practice is linked when it shares the group's website, or when its own website names the group. Heartland Dental's practices mostly keep local names; their sites describe them as part of the Orahh Care Dental Community, which Heartland launched for the practices it supports. We count about 2,007 Heartland-linked locations, close to Heartland's own figure of about 2,000 supported offices. A link to a group doesn't show who legally owns an office or who decides treatment.
| Group | Reported owners or investors | Locations linked | Source |
|---|---|---|---|
| Heartland Dental | KKR (majority since 2018) | 2,007 | 1 · 2 |
| Aspen Dental | Leonard Green & Partners, Ares Management, American Securities | 1,226 | 1 · 2 |
| Smile Brands | Gryphon Investors (since 2016) | 467 | 1 · 2 |
| Great Expressions | Roark Capital Group (since 2016) | 285 | 1 · 2 |
| Sage Dental | Linden Capital Partners | 167 | 1 · 2 |
| Ideal Dental (DECA) | Blackstone (since 2021) | 167 | 1 · 2 |
| Smile Doctors | Thomas H. Lee Partners, Linden Capital Partners | 117 | 1 · 2 |
| Dental365 | TJC (since 2021) | 97 | 1 · 2 |
| The Smilist | Zenyth Partners, BlackRock and Manulife (minority) | 95 | 1 · 2 |
| Jefferson Dental | Brentwood Associates (since 2017) | 76 | 1 · 2 |
| Smile Partners USA | Silver Oak Services Partners, BlackRock, Hollyport Capital | 72 | 1 · 2 |
Owners and investors come only from public sources we could open: the investor's portfolio page, the deal announcement or trade press, checked in November 2026. Some are minority or fund-level stakes. Groups whose current backing we couldn't confirm aren't named, and some large groups aren't in our list at all. Locations are distinct addresses among active listings.
Which group supports your dental practice?
Search a practice name or city to see the group link we could document and the group's reported backers, as of November 2026. A link can mean business support without showing who legally owns the practice or who decides treatment. No result means we haven't found a link; it doesn't confirm the practice is independent.
| Practice | City | Group | Group's reported backers | How we know |
|---|
What an earlier study found in insurance data
A separate study looked at the business side. Using insurance and practice data from 2015 to 2021, it found that after a private equity acquisition, offices raised their list charges by about 3.3%, shifted toward procedures that are generally paid at higher rates, and showed no statistically significant change in the prices they negotiated with insurers.
Our review analysis covers a later period and a different question. It doesn't test whether the same acquisitions caused complaints. Nasseh, LoSasso, Vujicic and Downey, "Financial Incisors", Health Services Research, online December 2025, April 2026 issue. Two of the authors work at the American Dental Association's Health Policy Institute.
Others have covered this ground too: KFF Health News and CBS News reported in 2024 on dentists removing treatable teeth for implants, and PE or Not tracks private equity ownership across health businesses.
What the groups say
Each named group is being invited to check its figures and how its practices were identified, and to respond. We'll add their answers here as they come in, and correct anything that's wrong.
Questions to ask before treatment
- Who supports the practice? Look at the bottom of its website and its privacy policy for a group name, or ask the front desk.
- What are the options? Ask what happens if you wait, and whether there's a simpler or cheaper alternative.
- What will it cost? Ask for a written, itemized plan with what insurance is expected to cover, before agreeing to large work or financing.
- Is a second opinion worth it? For large, expensive or irreversible treatment, another dentist's view can help.
How sure each number is
False matches. An AI model (GPT-6.1) read 120 randomly picked flagged reviews for each pattern in each group, without being told the practice or group. It judged 79.2% of the private equity groups' pressure flags real, against 73.3% at practices with no group link. Adjusting for that difference raises the pressure ratio slightly (1.69 to 1.83).
Missed complaints. The same model also read 600 randomly picked low-rated reviews from each side that matched neither pattern. It found a pressure complaint in 101 (17%) at the private equity-backed groups and 43 (7%) at practices with no group link. So the pattern catches only about one in 5 of the pressure complaints the model finds at the chains, and one in 4 elsewhere. Counting the misses, roughly 20% of the groups' low-rated reviews would describe pressure (range 17 to 22%), against 9% (range 7 to 11%) with no group link, not weighted by state. If that holds, the real gap is larger than the pattern figures show, not smaller. It's one model's reading of a modest sample, so the headline stays with the pattern figures.
No person has re-checked these judgments yet, and only the pressure and unnecessary-treatment patterns were checked. The other patterns, and each named group's figures, weren't checked separately.
What this can't tell you
- Cause. This compares practices; it doesn't show that a sale changed any of them. Chains may serve different patients, in different places, with different expectations.
- Whether each complaint is right. A review is one side of a story. We measured how often complaint patterns appear; we didn't check the treatment or bills behind them.
- Any one practice or dentist. Figures are for groups. Nothing here says a particular office treats patients badly.
- Who writes reviews. Practices may ask for reviews in different ways. Comparing what low-rated reviews say reduces that problem but doesn't remove it. These are not complaints per patient.
- Timing. Group status is as of November 2026 and applied to reviews back to 2023, so some reviews predate a practice joining or leaving a group.
How we measured it
- Reviews
- Written one- and two-star reviews on the public business listings of US dental practices, January 2023 to September 2026, collected by toothlocal. Reviews removed before collection aren't included.
- Practices and groups
- A practice listing is linked to a group when it shares the group's website, or when its own website says a group owns, runs or supports it (each such line read and confirmed by an AI model, with the exact wording kept). Locations are distinct addresses among active listings.
- Backing
- Each group's reported owners from public sources, checked in November 2026. "Lender-owned" means a 2026 restructuring passed control to the chain's lenders.
- Comparison
- For each group, the rate at practices with no group link is worked out state by state and averaged using the group's own mix of low-rated reviews by state. The specialty check does the same within each state and specialty. Ranges come from resampling practices 400 times.
- Dropped
- We also compared what group and independent websites advertise, but group sites share templates, so the figures described site designs rather than practices. We left them out.
- About toothlocal
- toothlocal is a free dentist finder. No practice can pay to change where it appears or what we show. About us, How we know. Something wrong? Tell us.
Run a practice? Share the data, and tell us what you see
Dentists know more about this than any dataset. If you work in a private practice or a group, here's what you can share, and two ways to add your voice.
What the data supports
- In bad reviews, patients at private equity-backed dental chains mention pressure to buy treatment more often: 5.0% against 3.0% at practices with no group link in the same states.
- About 1 in 9 reviews at these chains is one or two stars, against about 1 in 27 at practices with no group link.
- It isn't every chain, and other dental groups get fewer pressure complaints than practices with no group link. This compares what reviews say, not the quality of anyone's dentistry.
Ready to post
Square images for social posts are in Charts and data.
Add your voice
- Take the anonymous dentist survey (2 minutes). Production targets, treatment coordinators, what you've seen in private practice and in groups. No name or email; we'll publish the results.
- Independently owned practice? Use the contact form and choose "My practice is independently owned". Once we've checked it, your toothlocal page will say so.
Use the charts and data
Our charts and aggregate data files are free to use under CC BY 4.0: credit toothlocal and link to this page. Patient reviews themselves aren't redistributed.
The key figures, ready to quote
In one- and two-star reviews from January 2023 to September 2026, toothlocal's search patterns flagged pressure to buy treatment in 5.0% at dental groups backed by private equity, against 3.0% at practices with no identified group link in the same states.
Aspen Dental and Heartland Dental account for 75% of those low-rated reviews; without them, the pressure-complaint share is 1.2 times the comparison rate rather than 1.7.
Of 9 private equity-backed dental groups with at least 500 low-rated reviews, 4 run clearly above the comparison rate for pressure complaints; the rest are level or below.
toothlocal could link about 4,800 US dental locations to groups backed by private equity, in November 2026.
Dental groups without private equity backing had a lower pressure-complaint share in low-rated reviews (2.2%) than practices with no group link (3.1%).
Cite
Charts
Data files
- By state dental locations linked to private equity-backed groups
- By city cities with 150+ dental locations
- Bad-review share 1- and 2-star share of all reviews, by type and group
- Complaints by owner type 8 themes, with 95% intervals and same-state comparison
- By group named groups with ownership sources
- Robustness checks specialty, leave-one-group-out, 95% ranges
- By year January to September, 2023 to 2026
- Accuracy check 480 reviews read blind
Other things we looked at
These are descriptive and not adjusted for specialty or place, so they're kept apart from the main finding.
- By year. Comparing January to September each year, the share of low-rated reviews flagged for pressure or unnecessary treatment went from 5.26% (2023) to 8.06% (2026) at private equity-backed groups, and from 4.34% to 5.61% at practices with no group link. The practices and reviewers behind each year change, so this doesn't show the same offices getting worse.
- License dates. In the eight states where we collected dental board license dates, the median dentist linked to a private equity-backed practice got that state's license 8.2 years ago, against 18.5 at practices with no group link (6,873 and 106,783 dentists). A state license date isn't years of experience.
- Children's Medicaid listings. 11% of practices linked to private equity-backed groups are listed in the federal Insure Kids Now directory, against 22% with no group link. Many chain practices focus on adults, and a listing doesn't confirm a practice takes new Medicaid patients.
- Debt. In 2026, lenders took control of three chains once backed by private equity: Dental Care Alliance (April), Sonrava Health, which runs Western Dental and Brident (May), and Affordable Care (August). Their low-rated reviews flag pressure less often than practices with no group link. A restructuring doesn't show any effect on care. Dental Care Alliance source · Sonrava source · Affordable Care source
Other reports
- How many dental practices are in the US? 2026 October 2026
- Dental chains vs independent dentists, 2026 October 2026
- AI Review Index 2026 October 2026
Compare dentists with more context
toothlocal brings together analysis of patient reviews, practice website information and available public license records to help you compare dentists. See how we collect and check the information.
Find a dentist near you